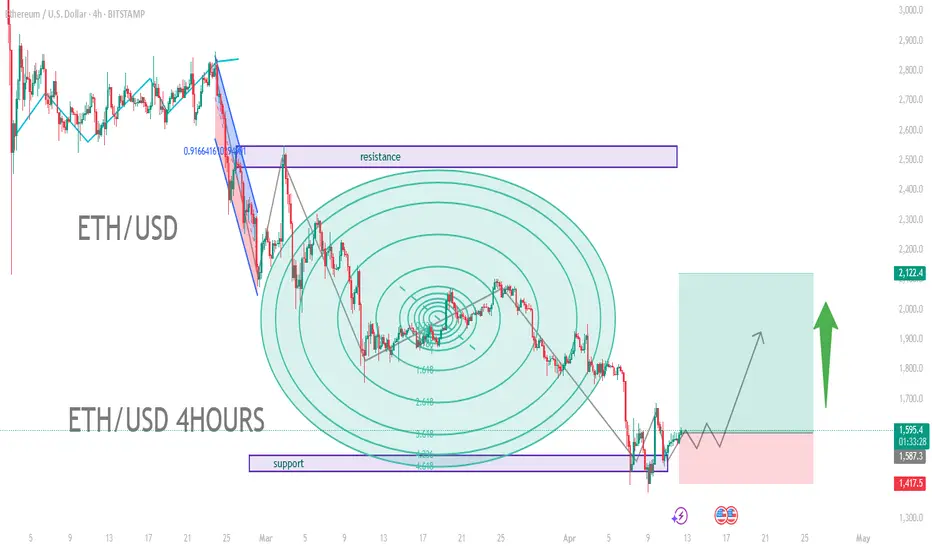
ETH/USD (Ethereum vs. US Dollar)
4-hour chart, meaning each candle represents 4 hours of trading activity.
2. Key Chart Features
Support and Resistance Zones:
Resistance: A rectangular box near the $2,600 to $2,800 price zone. This area previously acted as a ceiling where price was rejected.
Support: A box near the $1,700–$1,750 region. Price has bounced off this area, suggesting a strong demand zone.
Fibonacci Circles:
These concentric circles are used to project potential support/resistance levels and timing based on Fibonacci ratios.
The price seems to be reacting near some of these circle lines, which are drawn from a major swing high to swing low.
Price Action:
There was a strong downward movement (highlighted in blue) followed by a consolidation.
A potential bullish reversal is indicated on the right, with a possible breakout to the upside shown by the green arrow and price projection box.
Risk/Reward Setup:
A long trade setup is illustrated:
Entry around $1,800
Stop loss near $1,417.5
Target around $2,100 or higher
This reflects a bullish outlook with an upward price trajectory.
3. Indicators and Tools Used
Fibonacci Retracement and Fibonacci Circles
Price Action Zones (Support/Resistance)
Projection arrows and rectangular zone for trade visualization
交易進行
200 pips runing in profitt.me/+JvtzJ96BmqRhN2Jk
Free Education & Signal Daily
Focus on Gold/XAUUSD
5 years of Experience
Global Gold Trader
Sharp Entry & Sniper Entry
Free Education & Signal Daily
Focus on Gold/XAUUSD
5 years of Experience
Global Gold Trader
Sharp Entry & Sniper Entry
免責聲明
這些資訊和出版物並不意味著也不構成TradingView提供或認可的金融、投資、交易或其他類型的意見或建議。請在使用條款閱讀更多資訊。
t.me/+JvtzJ96BmqRhN2Jk
Free Education & Signal Daily
Focus on Gold/XAUUSD
5 years of Experience
Global Gold Trader
Sharp Entry & Sniper Entry
Free Education & Signal Daily
Focus on Gold/XAUUSD
5 years of Experience
Global Gold Trader
Sharp Entry & Sniper Entry
免責聲明
這些資訊和出版物並不意味著也不構成TradingView提供或認可的金融、投資、交易或其他類型的意見或建議。請在使用條款閱讀更多資訊。