### *The Analysis of "EURJPY" $-hour time frame Chart:
#### *1. Tools Used:*
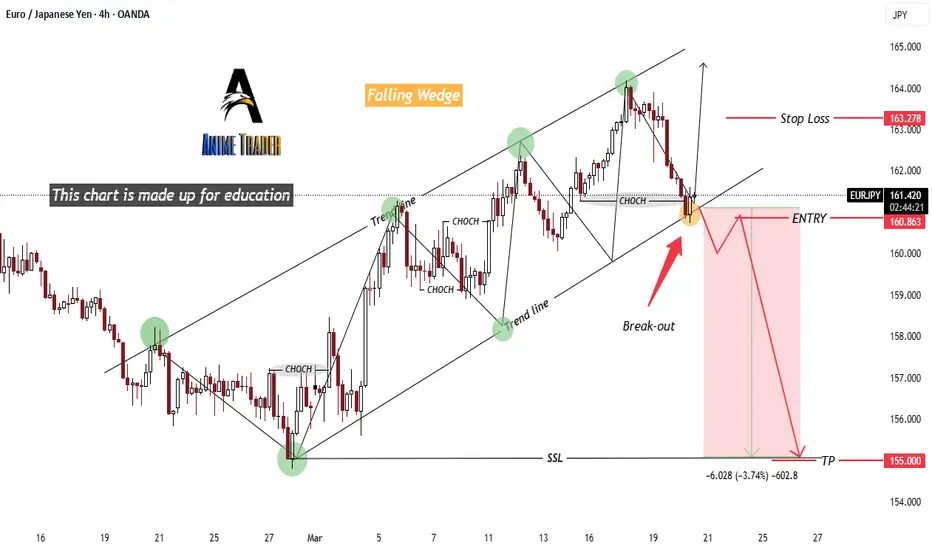
- *Trend Lines:*
- Two trend lines forming an *ascending channel* (uptrend structure).
- A breakout of the lower trend line suggests a potential bearish move.
- *Smart Money Concepts (SMC):*
- *CHOCH (Change of Character):* Indicates a shift in market direction.
- *SSL (Sell-Side Liquidity):* Suggests a liquidity grab before price moves lower.
- *Support & Resistance Levels:*
- *Stop Loss (SL)* is placed above the previous high.
- *Take Profit (TP)* is set at a significant support level near 155.000.
---
#### *2. Patterns Applied:*
- *Falling Wedge (Reversal Pattern):*
- The price has formed a rising channel that might break downwards.
- *Breakout & Retest:*
- Price has broken below the trendline and is expected to retest before continuing downward.
---
#### *3. Trade Setup & Expected Movement:*
- *Entry:* Below the trendline after the breakout.
- *Stop Loss (SL):* Above the last high (~163.278).
- *Take Profit (TP):* Near 155.000, targeting the next support level.
- *Risk/Reward Ratio:* The setup suggests a *bearish trade*, expecting a downward continuation.
### *Conclusion:*
- The chart suggests a *bearish setup* after breaking the ascending trendline.
- *If price re-enters the channel, the bearish trade could be invalidated.*
- The *Falling Wedge* pattern indicates a potential reversal, but confirmation is required.
Would you like a deeper breakdown of risk management for this trade?
#### *1. Tools Used:*
- *Trend Lines:*
- Two trend lines forming an *ascending channel* (uptrend structure).
- A breakout of the lower trend line suggests a potential bearish move.
- *Smart Money Concepts (SMC):*
- *CHOCH (Change of Character):* Indicates a shift in market direction.
- *SSL (Sell-Side Liquidity):* Suggests a liquidity grab before price moves lower.
- *Support & Resistance Levels:*
- *Stop Loss (SL)* is placed above the previous high.
- *Take Profit (TP)* is set at a significant support level near 155.000.
---
#### *2. Patterns Applied:*
- *Falling Wedge (Reversal Pattern):*
- The price has formed a rising channel that might break downwards.
- *Breakout & Retest:*
- Price has broken below the trendline and is expected to retest before continuing downward.
---
#### *3. Trade Setup & Expected Movement:*
- *Entry:* Below the trendline after the breakout.
- *Stop Loss (SL):* Above the last high (~163.278).
- *Take Profit (TP):* Near 155.000, targeting the next support level.
- *Risk/Reward Ratio:* The setup suggests a *bearish trade*, expecting a downward continuation.
### *Conclusion:*
- The chart suggests a *bearish setup* after breaking the ascending trendline.
- *If price re-enters the channel, the bearish trade could be invalidated.*
- The *Falling Wedge* pattern indicates a potential reversal, but confirmation is required.
Would you like a deeper breakdown of risk management for this trade?
t.me/Xauusdanalysischartexperts
I deliver high-quality of forex signals and expert premium analysis updates, backed by meticulous analysis tools. and a commitment to exceptional results.
t.me/Xauusdanalysischartexperts
I deliver high-quality of forex signals and expert premium analysis updates, backed by meticulous analysis tools. and a commitment to exceptional results.
t.me/Xauusdanalysischartexperts
免責聲明
這些資訊和出版物並不意味著也不構成TradingView提供或認可的金融、投資、交易或其他類型的意見或建議。請在使用條款閱讀更多資訊。
t.me/Xauusdanalysischartexperts
I deliver high-quality of forex signals and expert premium analysis updates, backed by meticulous analysis tools. and a commitment to exceptional results.
t.me/Xauusdanalysischartexperts
I deliver high-quality of forex signals and expert premium analysis updates, backed by meticulous analysis tools. and a commitment to exceptional results.
t.me/Xauusdanalysischartexperts
免責聲明
這些資訊和出版物並不意味著也不構成TradingView提供或認可的金融、投資、交易或其他類型的意見或建議。請在使用條款閱讀更多資訊。