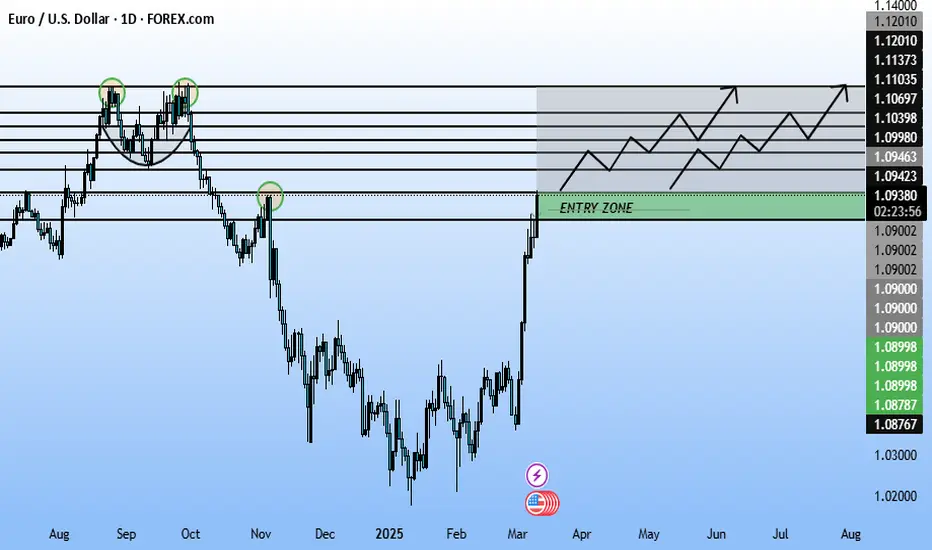
Euro / U.S. Dollar (EUR/USD) pair on a Daily (1D) timeframe.
Chart Details:
Exchange/Data Source: FOREX.com
Current Price: Around 1.09427
Recent Price Movement:
The chart shows a strong downward trend followed by a recovery.
Price has entered a potential entry zone, marked in green, suggesting a possible bullish reversal.
Key Levels:
Support Zone (Entry Zone): 1.08767 - 1.09427
Resistance Levels:
1.09986
1.10398
1.10697
1.11035
1.11373
1.12010 (Final Target)
Expected Price Action:
The chart suggests a bullish structure, with price expected to move upwards after testing the entry zone.
The zig-zag arrows indicate a potential higher-high and higher-low formation, leading to an upside breakout.
Trading Idea:
Potential Buy Entry: 1.08767 - 1.09427 (Entry Zone)
First Target: 1.09986
Second Target: 1.10697
Third Target: 1.11373
Final Target: 1.12010
Invalidation Level (Stop-Loss): Below 1.08767
This setup suggests a bullish continuation, but confirmation with additional indicators (like RSI, MACD) is recommended before entering a trade!
交易進行
Active Trade Let's put the enteries and make profit together,免責聲明
這些資訊和出版物並不意味著也不構成TradingView提供或認可的金融、投資、交易或其他類型的意見或建議。請在使用條款閱讀更多資訊。
免責聲明
這些資訊和出版物並不意味著也不構成TradingView提供或認可的金融、投資、交易或其他類型的意見或建議。請在使用條款閱讀更多資訊。