看多
G999 positive trend

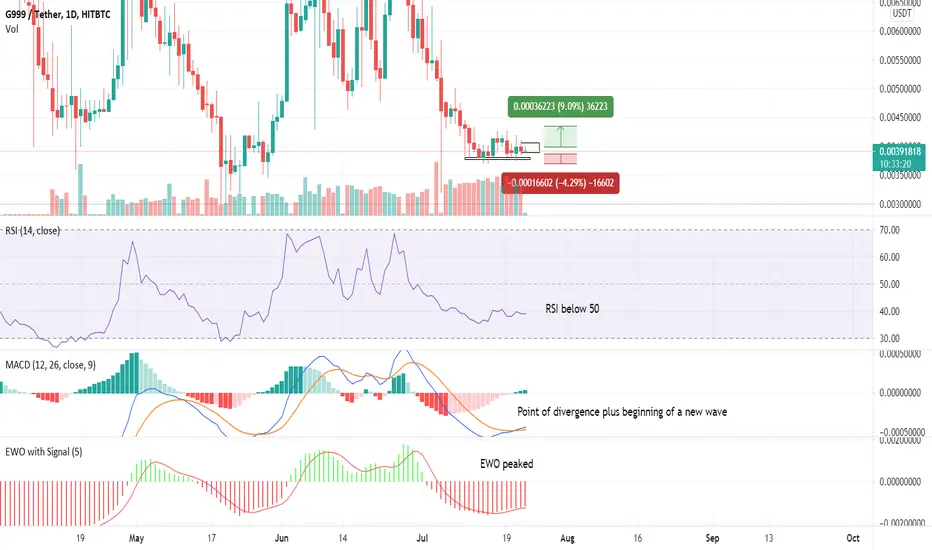
G999 chart indicates in several ways change of trend. Such as: RSI below 50, EWO peaked and MACD wave change as well as point of convergence happening. All of that allows me to assume a change of trend for G999. To use it, I've made buy setup below:
Buy price: 0.0039200-0.0039500
Take profit: 0.00434871
Stop loss: 0.00369971
Buy price: 0.0039200-0.0039500
Take profit: 0.00434871
Stop loss: 0.00369971
免責聲明
這些資訊和出版物並不意味著也不構成TradingView提供或認可的金融、投資、交易或其他類型的意見或建議。請在使用條款閱讀更多資訊。