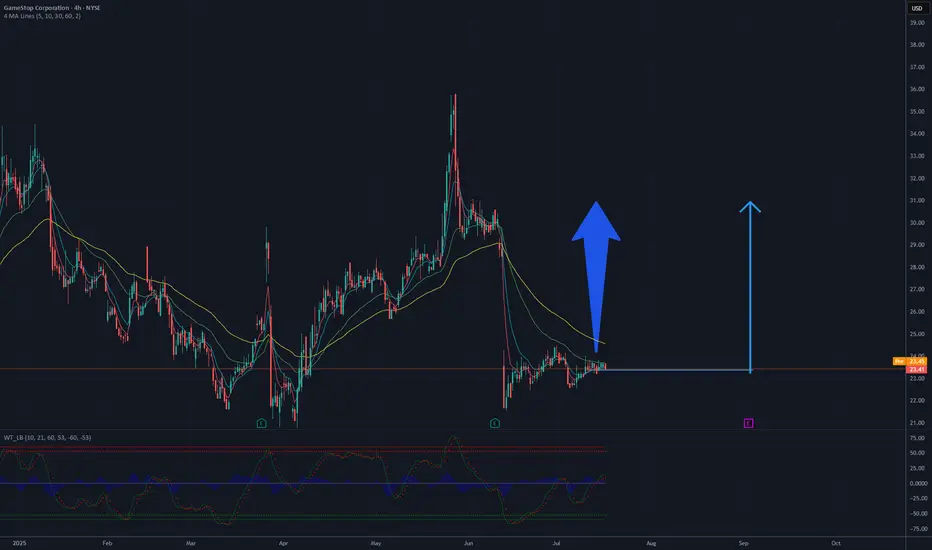
Analysis of the GameStop (GME) chart suggests a potential rise to 30 USD, based on current trends and technical levels. The 4-hour chart shows a recent decline following a sharp increase, with the price currently fluctuating around 23-24 USD. Key support is located at approximately 22 USD, which could act as a floor if the price starts to drop. The moving averages (e.g., 50-day and 200-day) indicate a previous upward trend, and current levels may represent a consolidation phase before the next upward move.
Breaking through resistance around 25-26 USD, which aligns with a previous peak, could pave the way for further growth. If demand increases and trading volume rises, the price could head toward 30 USD, a psychological and technical resistance level. Additional bullish signals, such as green candles or an increase in the oscillator (e.g., RSI) from current levels, could support this scenario. However, the risk of a sudden reversal should be monitored, especially if support at 22 USD is breached.
Potential TP: 30 USD
免責聲明
這些資訊和出版物並不意味著也不構成TradingView提供或認可的金融、投資、交易或其他類型的意見或建議。請在使用條款閱讀更多資訊。
免責聲明
這些資訊和出版物並不意味著也不構成TradingView提供或認可的金融、投資、交易或其他類型的意見或建議。請在使用條款閱讀更多資訊。