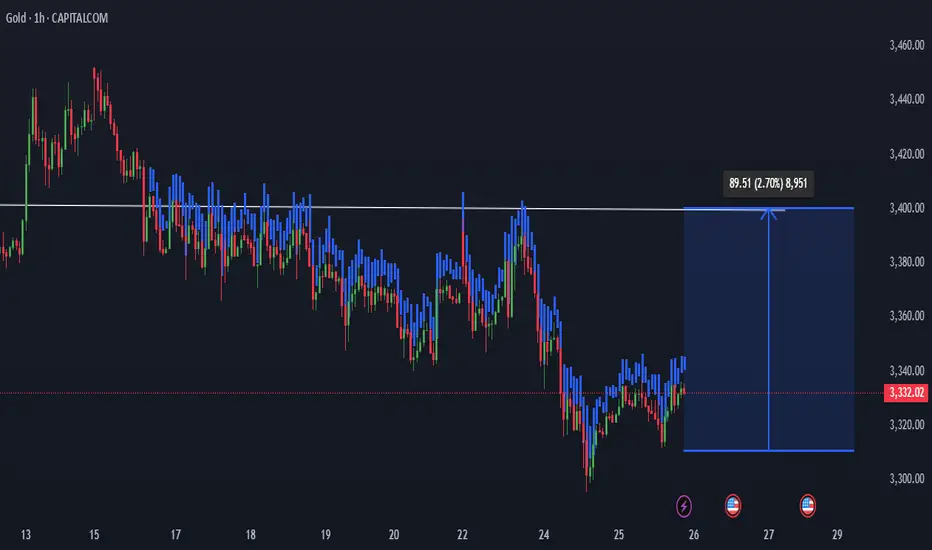
Current Price: ~$3,332
Resistance Level: ~3,400 (marked by the horizontal white line)
Potential Upside Target: Approximately 3,421
Expected Move: +89.51 points (+2.70%)
📈 Technical Interpretation:
Price Structure: After a recent downtrend, price appears to be forming a base and starting to bounce.
Bullish Breakout Potential: The blue shaded area suggests a bullish projection. If price breaks above the resistance (around 3,400), a move toward ~3,420+ is expected.
Volume Profile Overlay (Blue/Red Bars): Suggests historical volume concentration. Price might face resistance at the high-volume area (resistance line), but a breakout would signal strength.
✅ Bullish Scenario:
Entry Zone: Around current level (3,330–3,340), ideally on a breakout above 3,340.
Target: 3,420+
Risk: Breakdown below recent lows (~3,310–3,320) would invalidate the bullish idea
免責聲明
這些資訊和出版物並不意味著也不構成TradingView提供或認可的金融、投資、交易或其他類型的意見或建議。請在使用條款閱讀更多資訊。
免責聲明
這些資訊和出版物並不意味著也不構成TradingView提供或認可的金融、投資、交易或其他類型的意見或建議。請在使用條款閱讀更多資訊。