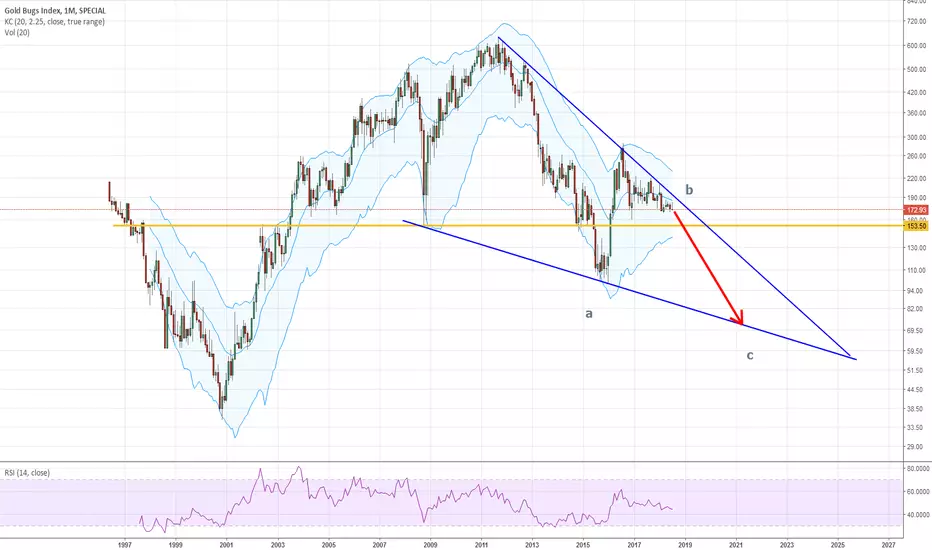
This chart looks horrible for the goldbugs. The long fight about the EMA 20 is lost and therefore a rapid decline is probable, which may accelerate with the bearish crossing of the important horizontal support (yellow). Target is the lower leg of the bullish wedge. Afterwards there may be a big move to the upside as a wave 3.
免責聲明
這些資訊和出版物並非旨在提供,也不構成TradingView提供或認可的任何形式的財務、投資、交易或其他類型的建議或推薦。請閱讀使用條款以了解更多資訊。