25th April 2025 / 9:40 AM
Why INDUSTOWER??
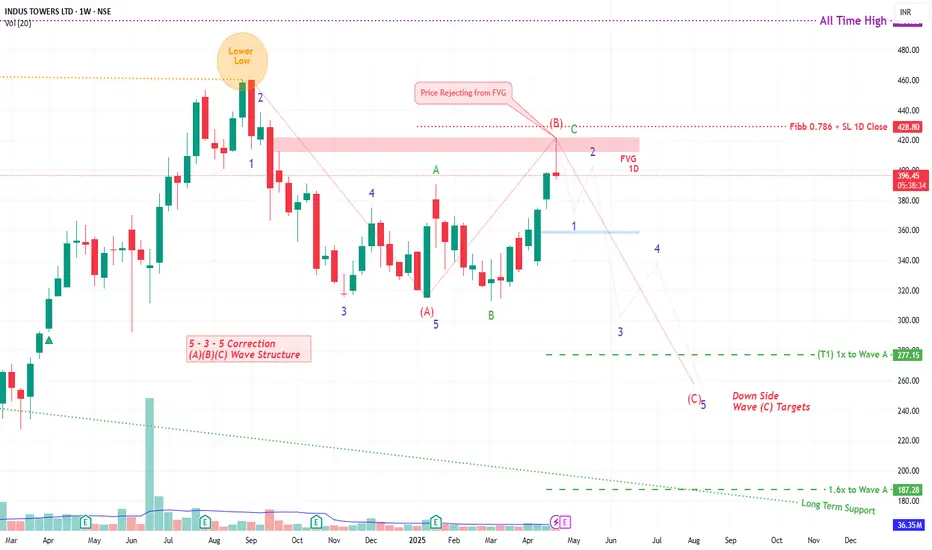
1. Stock was reached its near ATH level but not able to hold the levels in Sep 2024. From this point to today it seems like bullishness is getting weaker.
2. Wave Theory is saying Correction Wave ABC is ongoing and C is likely Started.
3. In support of more Correction from here FVG is visible in 1D TF and price are rejected from that level too.
4. Expecting correction from here in 5 Wave Structure towards downside.
Expected Targets and SL are mentioned in Chart
Note: This is Medium to Long Term View
交易進行
Gets Liquidity at 412 413 Rs range which is lower band of FVG.Yet No Major Breakdown just price rejection is happening.
Nearest Breakdown will be below 403 Rs.
註釋
403 Rs Breakdown ‼️Entered another prev. Gap.
註釋
Gap Down Today ‼️Likely 3rd Wave of Correction Wave (C) 🤞
In 3rd Wave Gaps are runaway gaps which are not filled immediately.
註釋
Weakness is still visible sellers are taking dominance.交易結束:達到停損點
免責聲明
這些資訊和出版物並不意味著也不構成TradingView提供或認可的金融、投資、交易或其他類型的意見或建議。請在使用條款閱讀更多資訊。
免責聲明
這些資訊和出版物並不意味著也不構成TradingView提供或認可的金融、投資、交易或其他類型的意見或建議。請在使用條款閱讀更多資訊。
