As of May 30, 2025, Jash Engineering Ltd. (NSE: JASH) is trading at approximately ₹559.40. Based on recent technical analyses, here are the 15-minute intraday support and resistance levels:
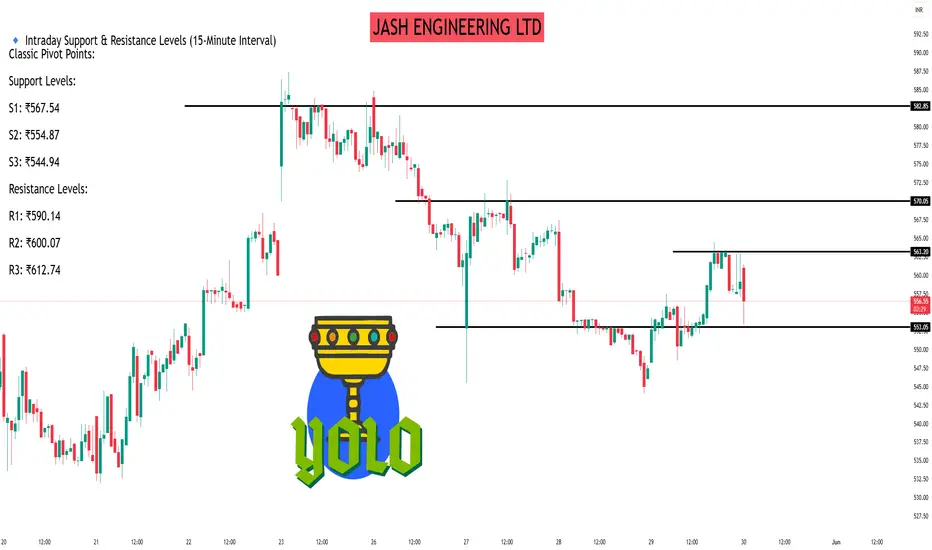
🔹 Intraday Support & Resistance Levels (15-Minute Interval)
Classic Pivot Points:
Support Levels:
S1: ₹567.54
S2: ₹554.87
S3: ₹544.94
Resistance Levels:
R1: ₹590.14
R2: ₹600.07
R3: ₹612.74
Fibonacci Pivot Points:
Support Levels:
S1: ₹568.84
S2: ₹563.50
S3: ₹554.87
Resistance Levels:
R1: ₹586.10
R2: ₹591.44
R3: ₹600.07
Camarilla Pivot Points:
Support Levels:
S1: ₹578.13
S2: ₹576.06
S3: ₹573.99
Resistance Levels:
R1: ₹582.27
R2: ₹584.34
R3: ₹586.42
Note: These levels are derived from pivot point calculations and can vary based on market conditions.
📊 Technical Indicators
Moving Averages: The stock is currently below both short-term and long-term moving averages, indicating a bearish trend.
MACD: A bullish crossover has been observed, suggesting potential upward momentum.
RSI: The Relative Strength Index is in the neutral zone, indicating neither overbought nor oversold conditions.
🔍 Observations
The stock has recently tested the support level around ₹539.50, which may act as a strong base.
Resistance is observed near ₹554.05, and a breakout above this level could signal further upside.
The stock's volatility is moderate, with a daily average movement of approximately 4.39%.
Hello Guys ..
WhatsApp link- wa.link/d997q0
Email - techncialexpress@gmail.com ...
Script Coder/Trader//Investor from India. Drop a comment or DM if you have any questions! Let’s grow together!
WhatsApp link- wa.link/d997q0
Email - techncialexpress@gmail.com ...
Script Coder/Trader//Investor from India. Drop a comment or DM if you have any questions! Let’s grow together!
相關出版品
免責聲明
這些資訊和出版物並不意味著也不構成TradingView提供或認可的金融、投資、交易或其他類型的意見或建議。請在使用條款閱讀更多資訊。