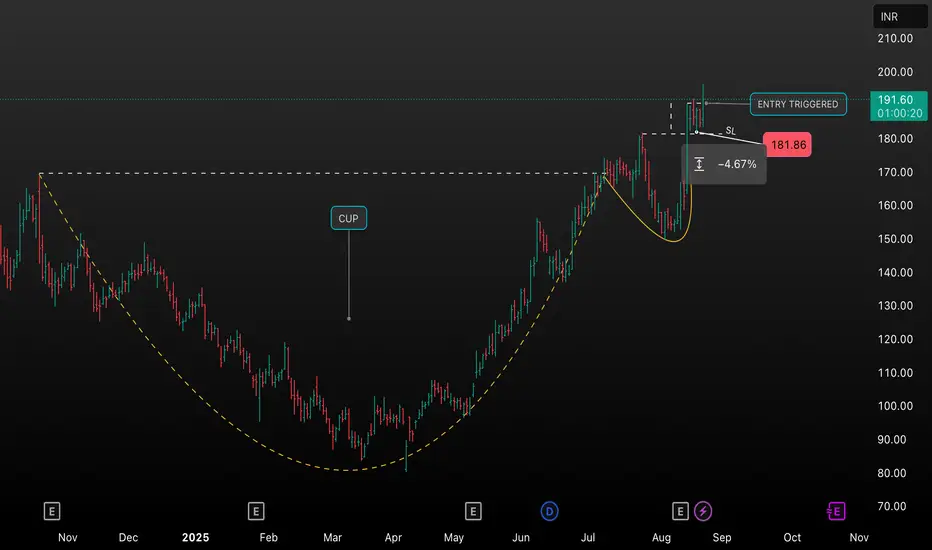
This TradingView chart shows JM Financial’s daily price action forming a classic cup and handle pattern. The price has broken out above the resistance line, triggering a bullish entry opportunity. Stop-loss (SL) is recommended at 181.86 (–4.67% from breakout), with potential for a continued uptrend. Key features:
• Pattern: Cup & Handle
• Entry: Breakout above resistance (triggered)
• Stop Loss: 181.86
• Timeframe: Daily
• Indicator: Volume supports breakout
Share your thoughts or analysis on this setup and let’s discuss the targets or risk management strategies for maximizing potential profits.
• Pattern: Cup & Handle
• Entry: Breakout above resistance (triggered)
• Stop Loss: 181.86
• Timeframe: Daily
• Indicator: Volume supports breakout
Share your thoughts or analysis on this setup and let’s discuss the targets or risk management strategies for maximizing potential profits.
免責聲明
這些資訊和出版物並不意味著也不構成TradingView提供或認可的金融、投資、交易或其他類型的意見或建議。請在使用條款閱讀更多資訊。
免責聲明
這些資訊和出版物並不意味著也不構成TradingView提供或認可的金融、投資、交易或其他類型的意見或建議。請在使用條款閱讀更多資訊。