📌 Overview: Understanding the Current Market Structure
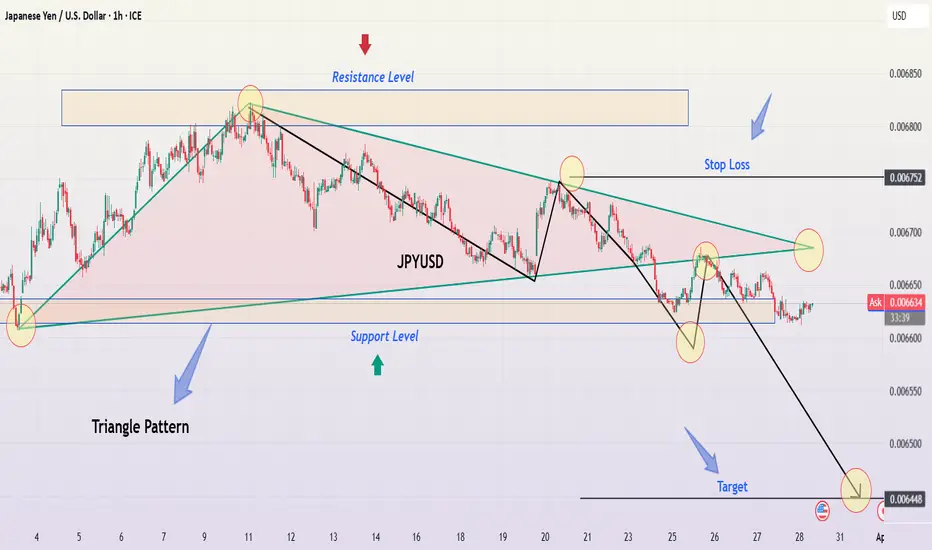
This analysis focuses on the JPY/USD pair on the 1-hour timeframe, highlighting a well-defined descending triangle pattern, a classic bearish continuation setup. The price action indicates selling pressure increasing as lower highs form, while support remained relatively stable before ultimately breaking down.
This setup suggests a potential trend continuation to the downside, making it a compelling trade opportunity for short-sellers. Let's dive deeper into the technical breakdown, trading strategy, and market expectations.
📊 Technical Breakdown: Chart Pattern Analysis
1️⃣ The Descending Triangle Pattern: A Bearish Signal
The descending triangle is one of the most reliable continuation patterns in technical analysis, often leading to a breakdown when support is breached. This chart confirms the pattern through:
✅ Downward Sloping Resistance Line:
The price tested this level multiple times but was consistently rejected.
Lower highs indicate sellers are dominating and buyers are failing to push higher.
✅ Flat Support Level:
The price found strong support at a key horizontal level, bouncing off multiple times.
However, each bounce became weaker, signaling buyers losing strength.
✅ Breakout & Confirmation:
The final breakdown below support occurred with strong momentum.
The price has now turned previous support into resistance, a bearish confirmation.
🔎 Implication:
A descending triangle breakout to the downside often results in an extended downward move, aiming for the measured move target based on the triangle’s height.
2️⃣ Key Price Levels & Trading Zones
📌 🔴 Resistance Zone (Upper Triangle Boundary):
0.006700 – 0.006750
This level acted as a strong rejection zone, confirming lower highs.
It now serves as a resistance level after the breakdown.
📌 🟢 Support Level (Triangle Base):
This level previously held price from breaking lower multiple times.
However, with each bounce becoming weaker, it finally gave way.
Break & Close below this level confirms the bearish continuation.
📌 🎯 Target Projection (Based on Triangle Breakout):
0.006448 (Final Target) – This level aligns with historical price action and the triangle’s projected move.
📌 🚨 Stop Loss Placement:
Above the last swing high (~0.006752)
If price reclaims this zone, the bearish outlook becomes invalid.
📈 Price Action & Market Sentiment
3️⃣ Bearish Momentum & Breakdown Confirmation
✅ Lower Highs Indicate Weakness:
Buyers attempted multiple recoveries but were consistently rejected at lower levels.
This pattern suggests exhaustion in buying pressure.
✅ Breakout Candle Strength & Volume Confirmation:
The price broke support with strong momentum and increased volume, confirming sellers’ control.
A breakdown without volume is often a fakeout, but this chart shows clear momentum.
✅ Potential Retest Before Further Drop:
After a breakdown, price often retests the broken support before continuing lower.
A pullback to the resistance zone (~0.006650 - 0.006700) could offer an ideal short entry.
✅ Bearish Trend Confirmation:
The price remains below key resistance and continues forming lower lows.
The downtrend structure remains intact, reinforcing the bearish sentiment.
📉 Trading Strategy: How to Trade This Setup?
🔹 Entry Strategy:
Ideal Entry: Short after a pullback to broken support (~0.006650 - 0.006700).
Aggressive Entry: Short immediately on the breakdown if momentum remains strong.
🔹 Stop Loss Placement:
Place above last swing high (0.006752) to avoid being stopped out by noise.
Ensures protection against sudden bullish reversals or fakeouts.
🔹 Take Profit Targets:
✅ First Target: 0.006500 (Psychological level)
✅ Final Target: 0.006448 (Triangle measured move)
🔹 Risk Management:
Use a Risk-to-Reward ratio (RRR) of at least 1:2 for an optimal trade setup.
Never risk more than 2% of total capital per trade.
⚠️ Market Outlook & Key Watchpoints
📌 Scenario 1: Bearish Continuation (High Probability)
If price retests the broken support and faces rejection, expect further downside.
Target remains at 0.006448.
📌 Scenario 2: Fake Breakdown & Bullish Reversal (Low Probability)
If price closes above 0.006750, it invalidates the bearish setup.
In that case, a bullish move towards 0.006800+ is possible.
📢 Final Thoughts:
The bearish breakout is clear, but waiting for a proper pullback before entry is ideal.
Volume confirmation is crucial to avoid fakeouts.
If support turns into resistance, a high-probability short trade is set up.
🔹 What’s your take on this setup? Will JPY/USD reach its target? Drop your thoughts below! 🚀
#JPYUSD #ForexTrading #TechnicalAnalysis #PriceAction
免責聲明
這些資訊和出版物並不意味著也不構成TradingView提供或認可的金融、投資、交易或其他類型的意見或建議。請在使用條款閱讀更多資訊。