As of May 28, 2025, Kirloskar Industries Ltd. (NSE: KIRLOSIND) is trading at ₹3,739.20, marking a 6.03% increase from the previous close .
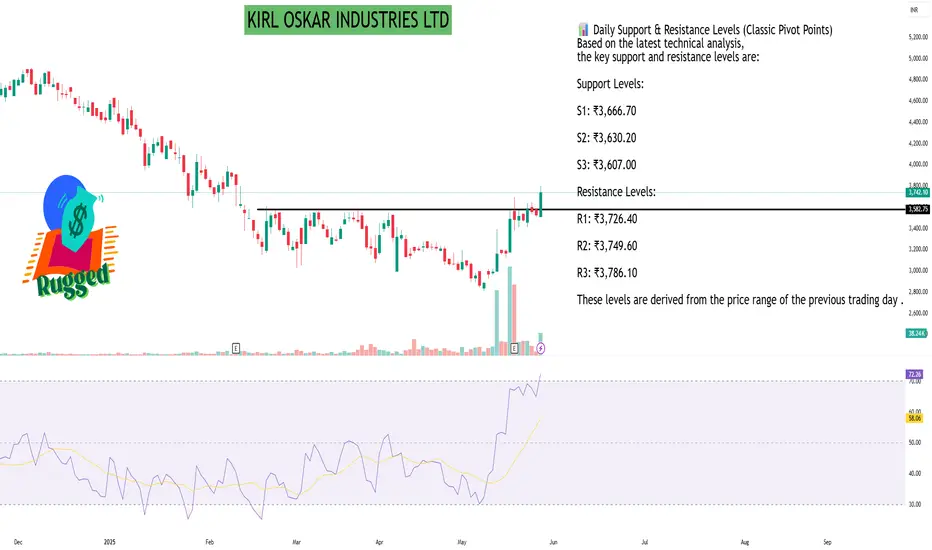
📊 Daily Support & Resistance Levels (Classic Pivot Points)
Based on the latest technical analysis, the key support and resistance levels are:
Support Levels:
S1: ₹3,666.70
S2: ₹3,630.20
S3: ₹3,607.00
Resistance Levels:
R1: ₹3,726.40
R2: ₹3,749.60
R3: ₹3,786.10
These levels are derived from the price range of the previous trading day .
📈 Technical Indicators Overview
Relative Strength Index (RSI): 77.5 – Indicates overbought conditions.
MACD (12,26): 47.84 – Suggests bullish momentum.
Commodity Channel Index (CCI): 165.79 – Points to strong upward movement.
Moving Averages: The stock is trading above its 5-day, 10-day, 20-day, 50-day, 100-day, and 200-day simple and exponential moving averages, indicating a strong bullish trend .
🔍 Market Sentiment
The technical indicators collectively suggest a strong bullish sentiment for Kirloskar Industries Ltd. However, the RSI indicates that the stock is in overbought territory, which may lead to a short-term correction. Investors should monitor the support and resistance levels closely for potential breakout or pullback scenarios.
Please note that stock market investments are subject to market risks, and it's essential to conduct thorough research or consult with a financial advisor before making investment decisions.
Hello Guys ..
WhatsApp link- wa.link/d997q0
Email - techncialexpress@gmail.com ...
Script Coder/Trader//Investor from India. Drop a comment or DM if you have any questions! Let’s grow together!
WhatsApp link- wa.link/d997q0
Email - techncialexpress@gmail.com ...
Script Coder/Trader//Investor from India. Drop a comment or DM if you have any questions! Let’s grow together!
相關出版品
免責聲明
這些資訊和出版物並不意味著也不構成TradingView提供或認可的金融、投資、交易或其他類型的意見或建議。請在使用條款閱讀更多資訊。