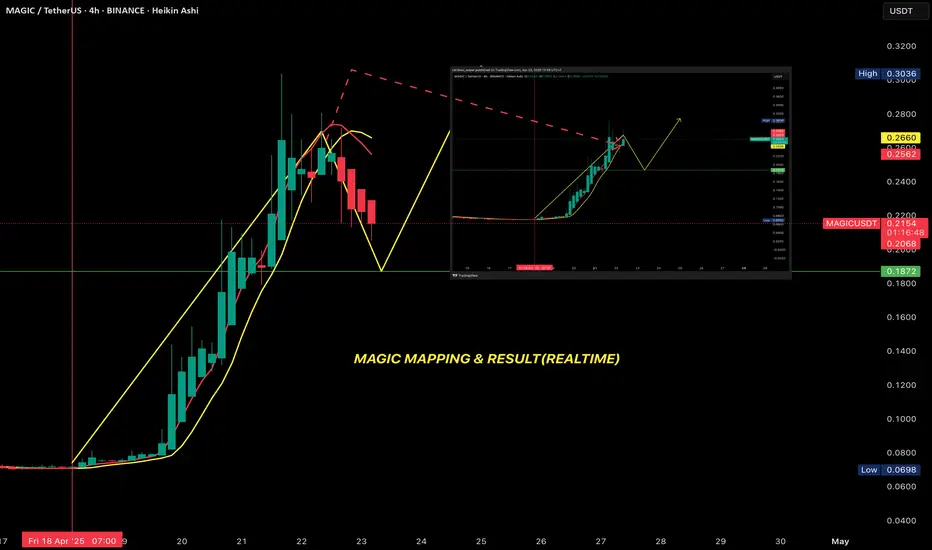
The discrepancy between mapping and the real-time market is almost zero.
This is pure luck, nothing else.
What is Mapping?
Mapping is a method of projecting outcomes based on reading current and historical real-time data. To achieve accurate mapping results, you need a system that correctly identifies trends, accurately detects peaks and troughs, and clearly defines what constitutes a Swing and what constitutes Scalping, as well as what a test is, where the test occurs, where the peak price is, and so on. Among these systems, the trend-reading system is the most critical—it must be absolutely accurate for the other systems to function correctly. If the trend is misread, the other systems are almost guaranteed to fail.
Mapping is merely a projection based on recommended data for users who lack such a system. With this system in place, we don’t need projections or mapping. We can wait for results, proactively seek results, or monitor outcomes as they unfold to take action.
For example, if you want to buy MAGIC again, you must wait for the H4 timeframe to signal a bottom. When the H4 system indicates that MAGIC has formed a bottom, we know it’s safe to buy. If you buy before the H4 confirms a bottom, you’re buying too early, the price may not move, and you’re likely to hit a Stop Loss (SL).
The RainBow MG3 Indicator identifies trends, reference prices, wave start times, and trend endpoints while sending alerts to your personal Telegram. Join the RainBow MG3 community on Telegram: t.me/rainbowmg3
免責聲明
這些資訊和出版物並不意味著也不構成TradingView提供或認可的金融、投資、交易或其他類型的意見或建議。請在使用條款閱讀更多資訊。
The RainBow MG3 Indicator identifies trends, reference prices, wave start times, and trend endpoints while sending alerts to your personal Telegram. Join the RainBow MG3 community on Telegram: t.me/rainbowmg3
免責聲明
這些資訊和出版物並不意味著也不構成TradingView提供或認可的金融、投資、交易或其他類型的意見或建議。請在使用條款閱讀更多資訊。