Bearish divergence in Matic Network
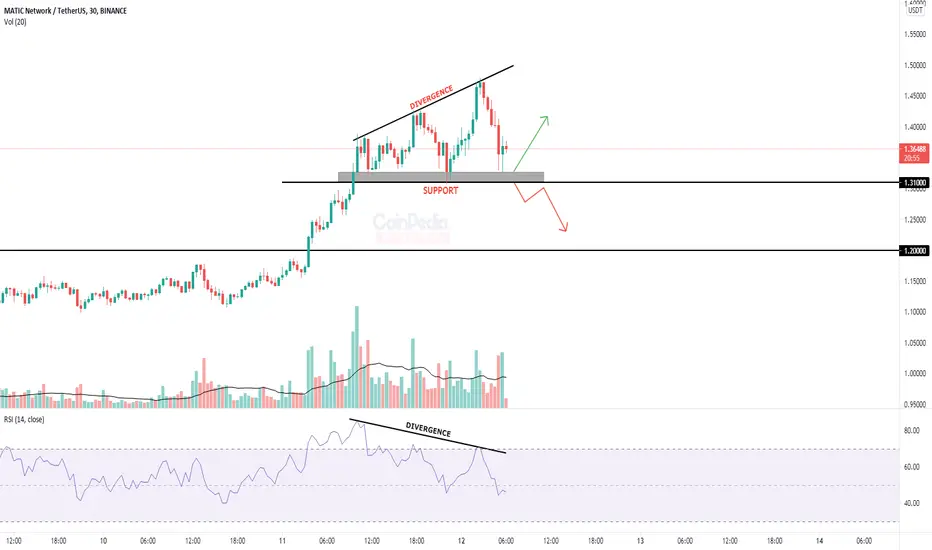
* Matic in 30 minutes time frame appears with bearish divergence.
* RSI divergence occurs when there is no longer the same momentum between the indicator and the price.
* If the price breaks it's support of $1.31000 we can see a drop till $1.2000.
* RSI divergence occurs when there is no longer the same momentum between the indicator and the price.
* If the price breaks it's support of $1.31000 we can see a drop till $1.2000.
免責聲明
這些資訊和出版物並不意味著也不構成TradingView提供或認可的金融、投資、交易或其他類型的意見或建議。請在使用條款閱讀更多資訊。
免責聲明
這些資訊和出版物並不意味著也不構成TradingView提供或認可的金融、投資、交易或其他類型的意見或建議。請在使用條款閱讀更多資訊。