Hello, traders.
If you "Follow", you can always get new information quickly.
Have a nice day today.
-------------------------------------
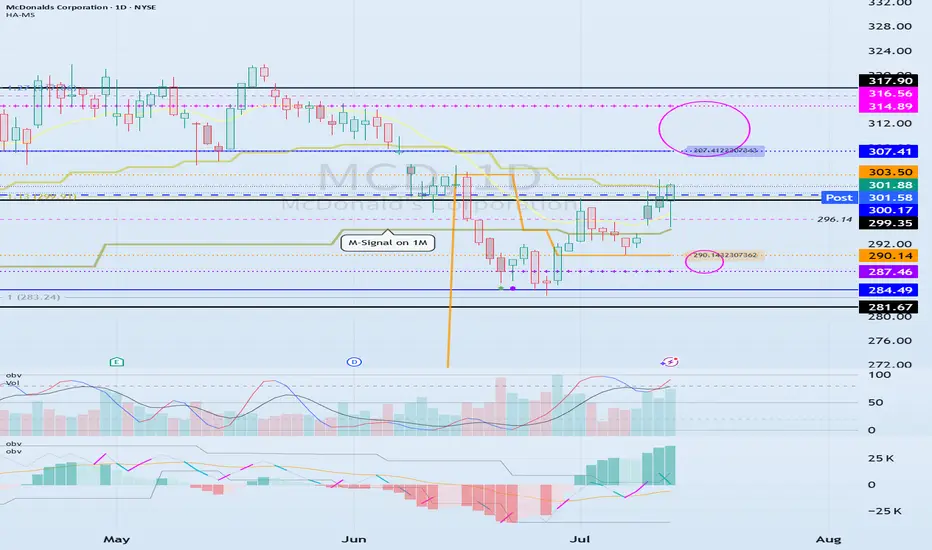
(MCD 1D chart)
Before following the basic trading strategy, the first thing to check is whether the current price is above or below the M-Signal indicator on the 1M chart.
If the price is below the M-Signal indicator on the 1M chart, there is a possibility that it will turn into a medium- to long-term downtrend.
Therefore, if possible, it is recommended to trade stocks whose prices are above the M-Signal indicator on the 1M chart.
If the price is below the M-Signal indicator on the 1M chart, you should respond quickly and briefly using the short-term trading (day trading) method.
-
The support and resistance zones can be seen as the 287.46-290.14 zone and the 307.41-314.89 zone.
The 287.46-290.14 zone is the DOM(-60) ~ HA-Low zone, and the 307.41-314.89 zone is the HA-High ~ DOM(60) zone.
These two zones are likely to form a trend depending on how they break through, so they can be seen as support and resistance zones.
-
The 300.17-316.56 zone is the HA-High ~ DOM(60) zone on the 1W chart.
Therefore, we need to check whether it can receive support and rise in the 300.17-316.56 zone.
Therefore, if it falls near the 307.41-314.89 range, you should check for support near 300.17.
-
If it rises above the HA-High ~ DOM(60) range, it is likely to show a step-up trend, and if it falls in the DOM(-60) ~ HA-Low range, it is likely to show a step-down trend.
-
Thank you for reading to the end.
I hope you have a successful transaction.
--------------------------------------------------
※ Follow X to check out the posts.
※ X를 팔로우하고 게시물을 확인하세요.
◆ t.me/readCryptoChannel
[HA-MS Indicator]
bit.ly/3YxHgvN
[OBV Indicator]
bit.ly/4dcyny3
※ X를 팔로우하고 게시물을 확인하세요.
◆ t.me/readCryptoChannel
[HA-MS Indicator]
bit.ly/3YxHgvN
[OBV Indicator]
bit.ly/4dcyny3
免責聲明
這些資訊和出版物並非旨在提供,也不構成TradingView提供或認可的任何形式的財務、投資、交易或其他類型的建議或推薦。請閱讀使用條款以了解更多資訊。