1-Hour Technical Outlook
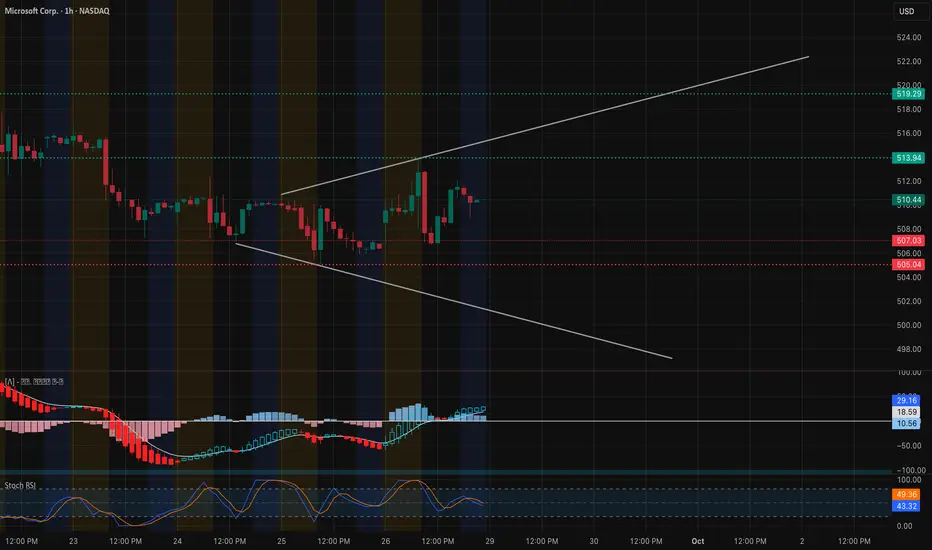
Microsoft is forming an expanding wedge after a week of sideways-to-up action. Price is trading around $510–$511, testing mid-wedge support after a strong bounce from the $505 floor. MACD histogram is positive and climbing, and the Stoch RSI is curling up from mid-range, signaling that momentum is resetting for another potential leg higher.
Key resistance to watch is $513.9, with heavier supply stacked at $519–$520. On the downside, the critical support remains $505, with a safety net near $500.
Gamma Exposure (GEX) Confirmation

Options positioning provides solid backup to the chart:
Largest positive GEX / Call Resistance sits at $512, now acting as the key breakout trigger.
Next call walls cluster at $519–$520 (~44% call interest), matching the top of the expanding wedge.
On the downside, put support is significant at $500, aligning with the technical safety zone.
This GEX structure suggests that a strong hourly close above $513.9 could unleash dealer hedging that pushes MSFT quickly toward $519–$520. If $505 fails, negative gamma flow may accelerate selling to the $500 area.
Trade Ideas & Option Plays for This Week
Bullish Play: Go long on a sustained move above $513.9, targeting $519–$520. Options: 1-week 515 calls or 515/520 call spreads to keep risk contained.
Protective Hedge / Bearish Setup: Short below $505, looking for a slide to $500. Suitable instruments: 505/500 put spreads or short-dated puts.
With IVR near 21.4 and IVx around 22.9, premiums are relatively mild—ideal for debit spreads.
My Take
MSFT is showing early signs of accumulation inside a broadening formation. Gamma levels perfectly reinforce the $512 breakout line and the $505 fail-safe. Unless sellers regain control under $505, the stock leans toward a bullish continuation this week.
Disclaimer: This analysis is for educational purposes only and does not constitute financial advice. Always do your own research and manage risk before trading.
Microsoft is forming an expanding wedge after a week of sideways-to-up action. Price is trading around $510–$511, testing mid-wedge support after a strong bounce from the $505 floor. MACD histogram is positive and climbing, and the Stoch RSI is curling up from mid-range, signaling that momentum is resetting for another potential leg higher.
Key resistance to watch is $513.9, with heavier supply stacked at $519–$520. On the downside, the critical support remains $505, with a safety net near $500.
Gamma Exposure (GEX) Confirmation
Options positioning provides solid backup to the chart:
Largest positive GEX / Call Resistance sits at $512, now acting as the key breakout trigger.
Next call walls cluster at $519–$520 (~44% call interest), matching the top of the expanding wedge.
On the downside, put support is significant at $500, aligning with the technical safety zone.
This GEX structure suggests that a strong hourly close above $513.9 could unleash dealer hedging that pushes MSFT quickly toward $519–$520. If $505 fails, negative gamma flow may accelerate selling to the $500 area.
Trade Ideas & Option Plays for This Week
Bullish Play: Go long on a sustained move above $513.9, targeting $519–$520. Options: 1-week 515 calls or 515/520 call spreads to keep risk contained.
Protective Hedge / Bearish Setup: Short below $505, looking for a slide to $500. Suitable instruments: 505/500 put spreads or short-dated puts.
With IVR near 21.4 and IVx around 22.9, premiums are relatively mild—ideal for debit spreads.
My Take
MSFT is showing early signs of accumulation inside a broadening formation. Gamma levels perfectly reinforce the $512 breakout line and the $505 fail-safe. Unless sellers regain control under $505, the stock leans toward a bullish continuation this week.
Disclaimer: This analysis is for educational purposes only and does not constitute financial advice. Always do your own research and manage risk before trading.
免責聲明
這些資訊和出版物並不意味著也不構成TradingView提供或認可的金融、投資、交易或其他類型的意見或建議。請在使用條款閱讀更多資訊。
免責聲明
這些資訊和出版物並不意味著也不構成TradingView提供或認可的金融、投資、交易或其他類型的意見或建議。請在使用條款閱讀更多資訊。