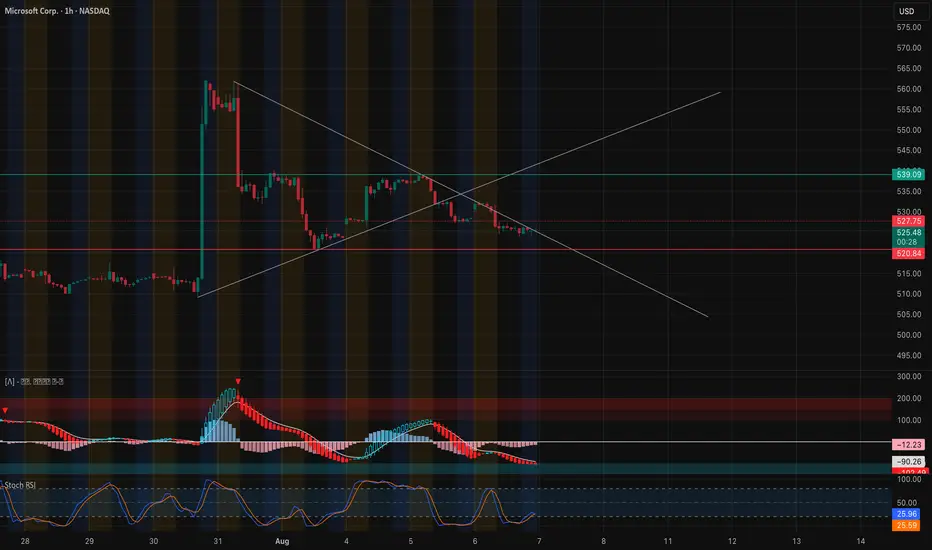
🧠 Technical Analysis (1H Chart Insight)
Microsoft (MSFT) is breaking down from a symmetrical triangle on the 1-hour chart, signaling bearish continuation after last week’s bounce attempt failed at $539. Price has been rejecting trendline resistance and is now coiling tightly under $527 — a major pivot zone.
* Structure: Bearish CHoCH confirmed; clean lower highs + lower lows forming.
* Trendline Break: Bearish breakdown under triangle.
* MACD: Bearish momentum increasing — histogram deepening, signal lines widening apart.
* Stoch RSI: Bearish crossover near overbought zone and turning down = more downside likely.
Support Zone to Watch:
* $525.17 → previous local support
* $520.84 → last defense before potential acceleration lower
Resistance to Break:
* $527.75 → old S/R flip
* $539.09 → invalidation of bearish thesis if reclaimed with volume
🧲 GEX & Options Sentiment (Aug 8 OPEX Focus)
The GEX map shows bearish tilt into the $520 zone:
* CALL Walls:
* $533.5–535 (63–73%) → capped any upside moves
* PUT Walls:
* $525 (HVL) → immediate pressure zone
* $520 → highest negative GEX, dealers likely to short-delta hedge below this
* $515 → strong put wall (-34.4%)
Gamma Exposure (GEX) Sentiment:
* IVR: 5.5 (very low)
* IVx Avg: 21.2
* Put flow: 10.6% → still light, but GEX is negative
* GEX < 520 → opens door for faster move lower
🧭 Trade Plan
📉 Bearish Scenario:
* Entry: Below $525 breakdown
* Target: $520 → $515
* Stop: Above $528
📈 Bullish Reversal Setup:
* Entry: Break and reclaim $528 with volume
* Target: $533.50 → $539
* Stop: Under $525
📌 This is a textbook momentum squeeze below the HVL line. Reclaim $527.75 and this gets neutralized fast. Stay nimble!
Disclaimer: This analysis is for educational purposes only and not financial advice. Always do your own research before trading.
免責聲明
這些資訊和出版物並不意味著也不構成TradingView提供或認可的金融、投資、交易或其他類型的意見或建議。請在使用條款閱讀更多資訊。
免責聲明
這些資訊和出版物並不意味著也不構成TradingView提供或認可的金融、投資、交易或其他類型的意見或建議。請在使用條款閱讀更多資訊。
