The NASDAQ , after peaking at an unprecedented 22,000 in 2024, has begun a corrective phase driven by pausing Federal Reserve interest rates, concerns over tech-sector profitability, and escalating geopolitical tensions and Trump Commands. This pullback reflects a shift away from growth stocks toward safer assets.
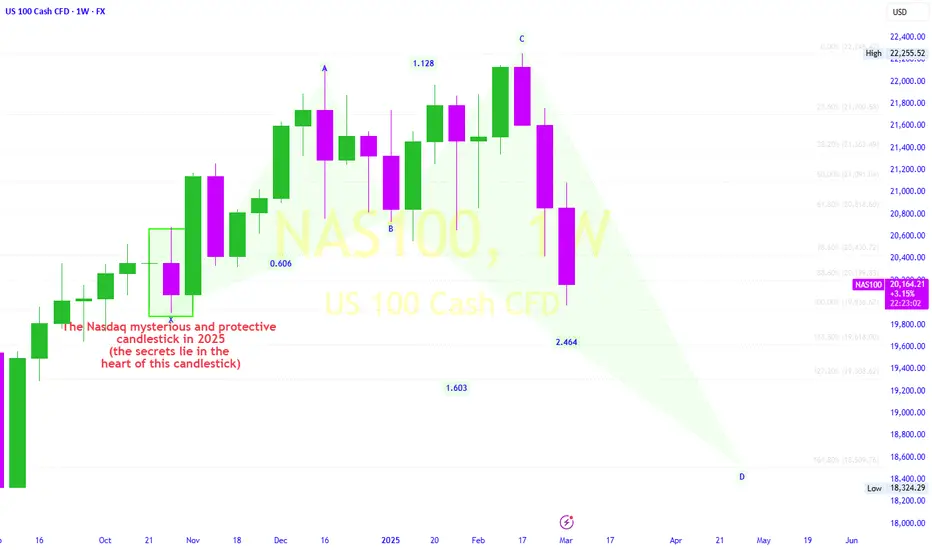
As outlined in this Chart, the index is now validating a bearish harmonic pattern (Crab), which typically signals major trend reversals.
The pattern’s completion zone aligns with key Fibonacci retracement levels (61.8–78.6%) of the 2022–2024 bull run, projecting downside targets:
Macro risks, such as prolonged restrictive monetary policy, slowing AI-driven earnings growth, and U.S.-China and US-Europe trade tensions, could accelerate this decline.
Traders are monitoring a decisive break below 20,500 with high volume to confirm bearish momentum, while a rebound from 18,500—coupled with reversal patterns like a double bottom may signal a short/mid-term buying opportunity.
This outlook hinges on earnings reports from mega-cap tech firms (Microsoft, Apple, NVIDIA) and Federal Reserve policy guidance.
As outlined in this Chart, the index is now validating a bearish harmonic pattern (Crab), which typically signals major trend reversals.
The pattern’s completion zone aligns with key Fibonacci retracement levels (61.8–78.6%) of the 2022–2024 bull run, projecting downside targets:
- - Near-term support: 20,000–20,500 (dynamic support near the 100-week moving average).
- - Intermediate zone: 19,000–19,500 (50% Fibonacci level and long-term trendline confluence).
- - Final target: 18,500 (78.6% Fibonacci retracement and psychological “golden support”).
Macro risks, such as prolonged restrictive monetary policy, slowing AI-driven earnings growth, and U.S.-China and US-Europe trade tensions, could accelerate this decline.
Traders are monitoring a decisive break below 20,500 with high volume to confirm bearish momentum, while a rebound from 18,500—coupled with reversal patterns like a double bottom may signal a short/mid-term buying opportunity.
This outlook hinges on earnings reports from mega-cap tech firms (Microsoft, Apple, NVIDIA) and Federal Reserve policy guidance.
註釋
NVDA 交易進行
TP 18.3k交易結束:目標達成
This idea is based on harmonic patterns and candlestick formations at Fibonacci levels. The targets for this order change along the way, depending on the candlestick patterns.
免責聲明
這些資訊和出版物並不意味著也不構成TradingView提供或認可的金融、投資、交易或其他類型的意見或建議。請在使用條款閱讀更多資訊。
This idea is based on harmonic patterns and candlestick formations at Fibonacci levels. The targets for this order change along the way, depending on the candlestick patterns.
免責聲明
這些資訊和出版物並不意味著也不構成TradingView提供或認可的金融、投資、交易或其他類型的意見或建議。請在使用條款閱讀更多資訊。