Henry Hub Natural Gas Future Weekly Analysis 10-14 June, 24
📈 Henry Hub Natural Gas Future Technical Chart Analysis
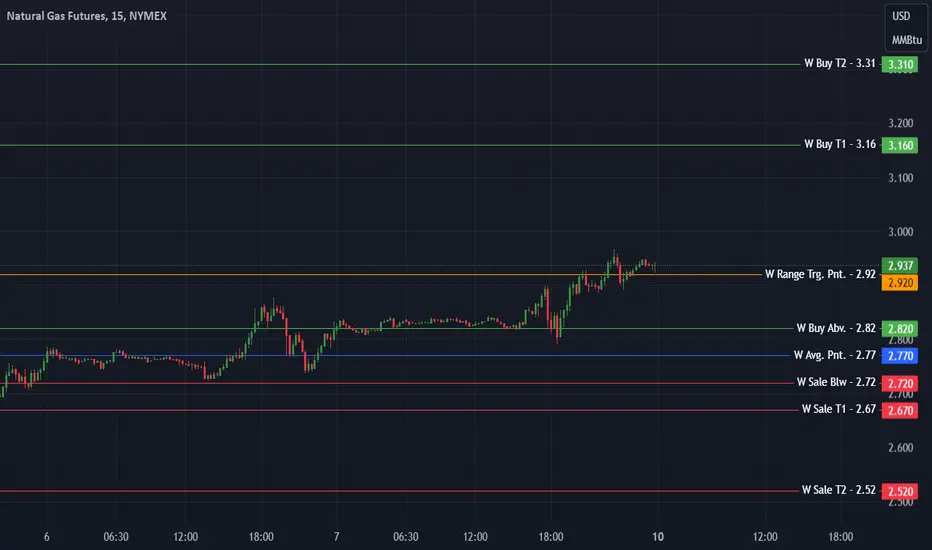
📆 Weekly Levels for 10-14 June, 2024:
📊 Weekly Movement Point: 2.92
📉 Weekly Range: 0.39
📈 Buy Above: 2.82
💼 Average At: 2.77
🎯 Buy Target 1: 3.16
🎯 Buy Target 2: 3.31
🛑 Buyer Stoploss: 2.69
💰 Sale Below: 2.72
🎯 Sale Target 1: 2.67
🎯 Sale Target 2: 2.52
🛑 Seller Stoploss: 2.85
✨ Boost, follow, and engage for more insightful updates. For detailed analysis and live discussions, check out our community channels. Your engagement fuels our dedication to providing top-notch content! 🚀❤️
#HenryHub #NaturalGas #GasFutures #CommoditiesTrading #MarketAnalysis #NG #GasPrices #NatGas #EnergyTrading #MCX #CommoditiesFutures #CommoditiesOptions
📊 Trading Consultant | Expert in Commodity & Index Analysis | India & US
Services:
✅ Intraday & Weekly Levels
✅ Guided Trading (Entry, Exit, Stoploss)
Contact for Services At:
📞 WhatsApp: +91-99288-36995
💬 Telegram Channel: @NumroTrader
Services:
✅ Intraday & Weekly Levels
✅ Guided Trading (Entry, Exit, Stoploss)
Contact for Services At:
📞 WhatsApp: +91-99288-36995
💬 Telegram Channel: @NumroTrader
免責聲明
這些資訊和出版物並不意味著也不構成TradingView提供或認可的金融、投資、交易或其他類型的意見或建議。請在使用條款閱讀更多資訊。