📌 Rolling VWAP Indicator – Performance on Nifty (15-Min)
How it Behaves in Real Market Structure
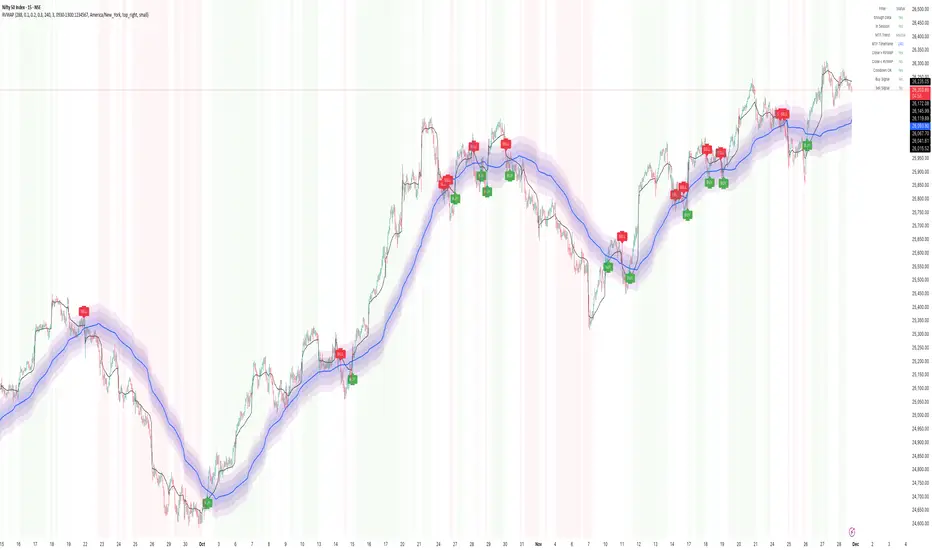
The Rolling VWAP indicator showcased here acts like a dynamic trend map, continuously recalculating volume-weighted averages over rolling windows. This helps the indicator adapt quickly to evolving intraday sentiment without getting stuck like a fixed-session VWAP.
Based on the attached Nifty 15-minute chart, here are the key observations:
1️⃣ Captures Trend Early & Smoothly
During strong directional phases (example: the mid-October uptrend and late-November rally), Rolling VWAP bands align beautifully with price:
• Price rides above the VWAP → sustained long bias
• Bands expand → trend strength
• Pullbacks respect the mid-VWAP zone → clean continuation signals
This allows traders to stay confidently in trending conditions.
⸻
2️⃣ Effective Reversal Spotting
The indicator prints clear reversal signals when:
• Price closes on the opposite side of the VWAP channel
• Band slope flips
• Background color switches sentiment
On the chart, almost every major swing—both tops and bottoms—was marked by timely reversal signals, allowing traders to exit early and flip positions with minimal lag.
⸻
3️⃣ Filters Out Low-Probability Zones
The shaded grey bands are extremely useful:
• They signify uncertain or transition zones
• Price inside this grey zone = Avoid trades
• Prevents traders from forcing entries during choppy consolidation
You can clearly see that avoiding these grey-zone candles eliminates many false breakouts.
⸻
4️⃣ Strong Performance in Volatile Retracements
Whenever price dipped sharply into the lower VWAP band during downswings, the indicator generated:
• Fast reversal confirmation (green markers)
• Early re-entry opportunities
• Clean identification of exhaustion points
This is visible near month-end corrections and early-October recovery.
⸻
5️⃣ Eliminates False Breakouts
One of the biggest advantages—
When price fakes a breakout and slips back into the band, the VWAP slope + sentiment shading instantly catches it.
You can see several red signals printed at failed upside attempts, preventing continuation trades that would otherwise trap traders.
⸻
6️⃣ Stable in Ranging Markets
Even in sideways phases, the Rolling VWAP structure:
• Narrow bands → low volatility awareness
• Light background shading → caution signals
• Very limited signals → avoids unnecessary trades
This keeps traders out of low-reward zones.
⸻
✨ Summary – Why It Works Well
➡️ Dynamic VWAP adapts faster than traditional VWAP
➡️ Clear trend detection with multi-layer bands
➡️ Reliable reversal confirmations
➡️ Grey no-trade zones prevent unnecessary entries
➡️ Visually intuitive sentiment shading
➡️ Works beautifully on index charts like Nifty and BankNifty
The overall performance on Nifty 15-min shows high consistency across trends, reversals, and retracements, making it a practical tool for intraday and positional index traders.
How it Behaves in Real Market Structure
The Rolling VWAP indicator showcased here acts like a dynamic trend map, continuously recalculating volume-weighted averages over rolling windows. This helps the indicator adapt quickly to evolving intraday sentiment without getting stuck like a fixed-session VWAP.
Based on the attached Nifty 15-minute chart, here are the key observations:
1️⃣ Captures Trend Early & Smoothly
During strong directional phases (example: the mid-October uptrend and late-November rally), Rolling VWAP bands align beautifully with price:
• Price rides above the VWAP → sustained long bias
• Bands expand → trend strength
• Pullbacks respect the mid-VWAP zone → clean continuation signals
This allows traders to stay confidently in trending conditions.
⸻
2️⃣ Effective Reversal Spotting
The indicator prints clear reversal signals when:
• Price closes on the opposite side of the VWAP channel
• Band slope flips
• Background color switches sentiment
On the chart, almost every major swing—both tops and bottoms—was marked by timely reversal signals, allowing traders to exit early and flip positions with minimal lag.
⸻
3️⃣ Filters Out Low-Probability Zones
The shaded grey bands are extremely useful:
• They signify uncertain or transition zones
• Price inside this grey zone = Avoid trades
• Prevents traders from forcing entries during choppy consolidation
You can clearly see that avoiding these grey-zone candles eliminates many false breakouts.
⸻
4️⃣ Strong Performance in Volatile Retracements
Whenever price dipped sharply into the lower VWAP band during downswings, the indicator generated:
• Fast reversal confirmation (green markers)
• Early re-entry opportunities
• Clean identification of exhaustion points
This is visible near month-end corrections and early-October recovery.
⸻
5️⃣ Eliminates False Breakouts
One of the biggest advantages—
When price fakes a breakout and slips back into the band, the VWAP slope + sentiment shading instantly catches it.
You can see several red signals printed at failed upside attempts, preventing continuation trades that would otherwise trap traders.
⸻
6️⃣ Stable in Ranging Markets
Even in sideways phases, the Rolling VWAP structure:
• Narrow bands → low volatility awareness
• Light background shading → caution signals
• Very limited signals → avoids unnecessary trades
This keeps traders out of low-reward zones.
⸻
✨ Summary – Why It Works Well
➡️ Dynamic VWAP adapts faster than traditional VWAP
➡️ Clear trend detection with multi-layer bands
➡️ Reliable reversal confirmations
➡️ Grey no-trade zones prevent unnecessary entries
➡️ Visually intuitive sentiment shading
➡️ Works beautifully on index charts like Nifty and BankNifty
The overall performance on Nifty 15-min shows high consistency across trends, reversals, and retracements, making it a practical tool for intraday and positional index traders.
Thanks.
TradeTech Analysis
Telegram Channel - t.me/Tradetech2024
Youtube Channel - youtube.com/@TradeTechAnalysis
Website - tradetechanalysis.com/
Super Profile - superprofile.bio/tradetechanalysis
TradeTech Analysis
Telegram Channel - t.me/Tradetech2024
Youtube Channel - youtube.com/@TradeTechAnalysis
Website - tradetechanalysis.com/
Super Profile - superprofile.bio/tradetechanalysis
相關出版品
免責聲明
這些資訊和出版物並非旨在提供,也不構成TradingView提供或認可的任何形式的財務、投資、交易或其他類型的建議或推薦。請閱讀使用條款以了解更多資訊。