4-Hour Chart (Macro Trend)
Structure: The Nifty is deep in a corrective phase, having broken the major 25,050 - 25,100 demand zone. The price is now trading at the lower boundary of a steep descending channel and sitting on a key demand zone at 24,600 - 24,700.
Key Levels:
Major Supply (Resistance): 25,000 - 25,100. This previous support is now a crucial overhead supply.
Major Demand (Support): 24,600 - 24,700. This is the key "line in the sand" for the medium-term rally. Below this, the next major support is near 24,400.
Outlook: The selling pressure has paused at a critical level. A failure to bounce convincingly from here will lead to the next sharp leg down.
1-Hour Chart (Intermediate View)
Structure: The 1H chart is strongly bearish, confined to a descending channel, with a clear sequence of lower highs and lower lows. The market closed right on the lower boundary of the demand zone.
Key Levels:
Immediate Resistance: The upper trendline of the descending channel, near 24,800.
Immediate Support: 24,600. This level must hold.
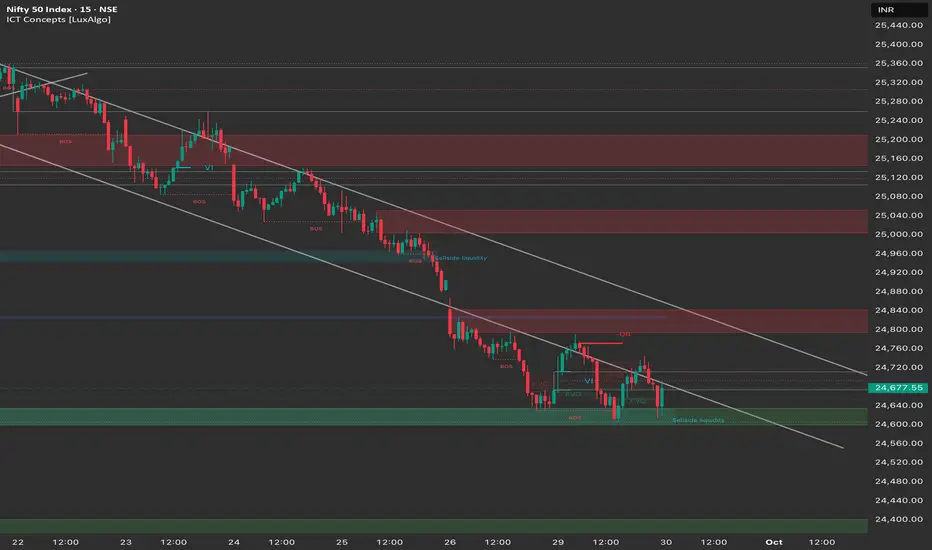
15-Minute Chart (Intraday View)
Structure: The 15M chart shows consolidation near the low, confirming a temporary pause in selling. Price is attempting to stabilize after breaking the 24,750 support and has taken liquidity below a recent low.
Key Levels:
Intraday Supply: 24,800. A key short-term resistance.
Intraday Demand: 24,600. The crucial support for the open.
Outlook: Bearish-to-Neutral. The primary direction is still bearish, but a bounce is possible from the strong support.
Trade Plan (Tuesday, 30th September)
Market Outlook: The Nifty is at a major support level. The strategy is to be reactive to a break of the consolidation boundaries.
Bearish Scenario (Primary Plan)
Justification: A continuation of the strong bearish trend following the break of major supports.
Entry: Short entry on a decisive break and 15-minute candle close below 24,600.
Stop Loss (SL): Place a stop loss above 24,700.
Targets:
T1: 24,500 (Minor psychological support).
T2: 24,400 (Next major demand zone).
Bullish Scenario (Counter-Trend/Reversal Plan)
Justification: Relies on the strong demand zone at 24,600 - 24,700 initiating a bounce.
Trigger: A sustained move and close above the immediate resistance at 24,800.
Entry: Long entry on a confirmed 15-minute close above 24,800.
Stop Loss (SL): Below 24,700.
Targets:
T1: 25,000 (Psychological resistance).
T2: 25,100 (Major supply zone).
Key Levels for Observation:
Immediate Decision Point: The 24,600 - 24,800 range.
Bearish Confirmation: A break and sustained move below 24,600.
Bullish Confirmation: A recapture of the 24,800 level.
Line in the Sand: 24,600.
Structure: The Nifty is deep in a corrective phase, having broken the major 25,050 - 25,100 demand zone. The price is now trading at the lower boundary of a steep descending channel and sitting on a key demand zone at 24,600 - 24,700.
Key Levels:
Major Supply (Resistance): 25,000 - 25,100. This previous support is now a crucial overhead supply.
Major Demand (Support): 24,600 - 24,700. This is the key "line in the sand" for the medium-term rally. Below this, the next major support is near 24,400.
Outlook: The selling pressure has paused at a critical level. A failure to bounce convincingly from here will lead to the next sharp leg down.
1-Hour Chart (Intermediate View)
Structure: The 1H chart is strongly bearish, confined to a descending channel, with a clear sequence of lower highs and lower lows. The market closed right on the lower boundary of the demand zone.
Key Levels:
Immediate Resistance: The upper trendline of the descending channel, near 24,800.
Immediate Support: 24,600. This level must hold.
15-Minute Chart (Intraday View)
Structure: The 15M chart shows consolidation near the low, confirming a temporary pause in selling. Price is attempting to stabilize after breaking the 24,750 support and has taken liquidity below a recent low.
Key Levels:
Intraday Supply: 24,800. A key short-term resistance.
Intraday Demand: 24,600. The crucial support for the open.
Outlook: Bearish-to-Neutral. The primary direction is still bearish, but a bounce is possible from the strong support.
Trade Plan (Tuesday, 30th September)
Market Outlook: The Nifty is at a major support level. The strategy is to be reactive to a break of the consolidation boundaries.
Bearish Scenario (Primary Plan)
Justification: A continuation of the strong bearish trend following the break of major supports.
Entry: Short entry on a decisive break and 15-minute candle close below 24,600.
Stop Loss (SL): Place a stop loss above 24,700.
Targets:
T1: 24,500 (Minor psychological support).
T2: 24,400 (Next major demand zone).
Bullish Scenario (Counter-Trend/Reversal Plan)
Justification: Relies on the strong demand zone at 24,600 - 24,700 initiating a bounce.
Trigger: A sustained move and close above the immediate resistance at 24,800.
Entry: Long entry on a confirmed 15-minute close above 24,800.
Stop Loss (SL): Below 24,700.
Targets:
T1: 25,000 (Psychological resistance).
T2: 25,100 (Major supply zone).
Key Levels for Observation:
Immediate Decision Point: The 24,600 - 24,800 range.
Bearish Confirmation: A break and sustained move below 24,600.
Bullish Confirmation: A recapture of the 24,800 level.
Line in the Sand: 24,600.
免責聲明
這些資訊和出版物並不意味著也不構成TradingView提供或認可的金融、投資、交易或其他類型的意見或建議。請在使用條款閱讀更多資訊。
免責聲明
這些資訊和出版物並不意味著也不構成TradingView提供或認可的金融、投資、交易或其他類型的意見或建議。請在使用條款閱讀更多資訊。