As of May 9, 2025, the Nifty Midcap Select Index is exhibiting a mildly bullish trend on the 4-hour timeframe, supported by various technical indicators and pivot point analyses.
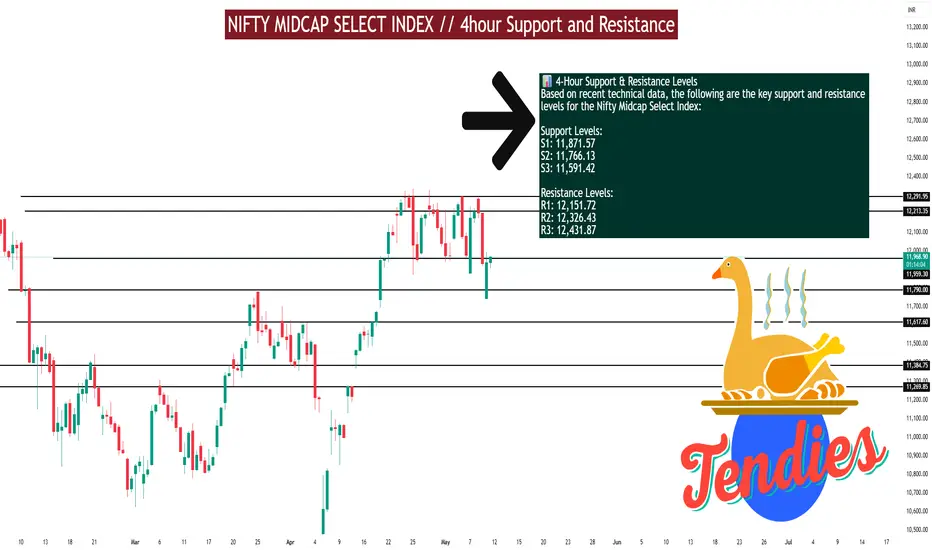
📊 4-Hour Support & Resistance Levels
Based on recent technical data, the following are the key support and resistance levels for the Nifty Midcap Select Index:
Support Levels:
S1: 11,871.57
S2: 11,766.13
S3: 11,591.42
Resistance Levels:
R1: 12,151.72
R2: 12,326.43
R3: 12,431.87
🔍 Technical Indicators (4-Hour Timeframe)
Relative Strength Index (RSI): 74.96 – approaching overbought territory, suggesting potential for a short-term pullback.
Moving Average Convergence Divergence (MACD): 250.27 – indicates bullish momentum.
Average Directional Index (ADX): 25.11 – signifies a strengthening trend.
Stochastic Oscillator: 96.87 – overbought condition, caution advised.
Supertrend Indicator: Positioned at 11,824.56 – currently acting as a support level.
Parabolic SAR: 11,733.42 – below the current price, reinforcing the bullish stance.
📈 Trend Analysis
The index is trading above its 5-period and 15-period simple moving averages on the 4-hour chart, indicating a mild bullish crossover. This suggests continued upward momentum in the near term.
⚠️ Trading Insights
Bullish Scenario: A sustained move above 12,151.72 could open the path toward 12,326.43 and potentially 12,431.87.
Bearish Scenario: Failure to hold above 11,871.57 may lead to a retest of 11,766.13 or even 11,591.42.
Hello Guys ..
WhatsApp link- wa.link/d997q0
Email - techncialexpress@gmail.com ...
Script Coder/Trader//Investor from India. Drop a comment or DM if you have any questions! Let’s grow together!
WhatsApp link- wa.link/d997q0
Email - techncialexpress@gmail.com ...
Script Coder/Trader//Investor from India. Drop a comment or DM if you have any questions! Let’s grow together!
相關出版品
免責聲明
這些資訊和出版物並不意味著也不構成TradingView提供或認可的金融、投資、交易或其他類型的意見或建議。請在使用條款閱讀更多資訊。