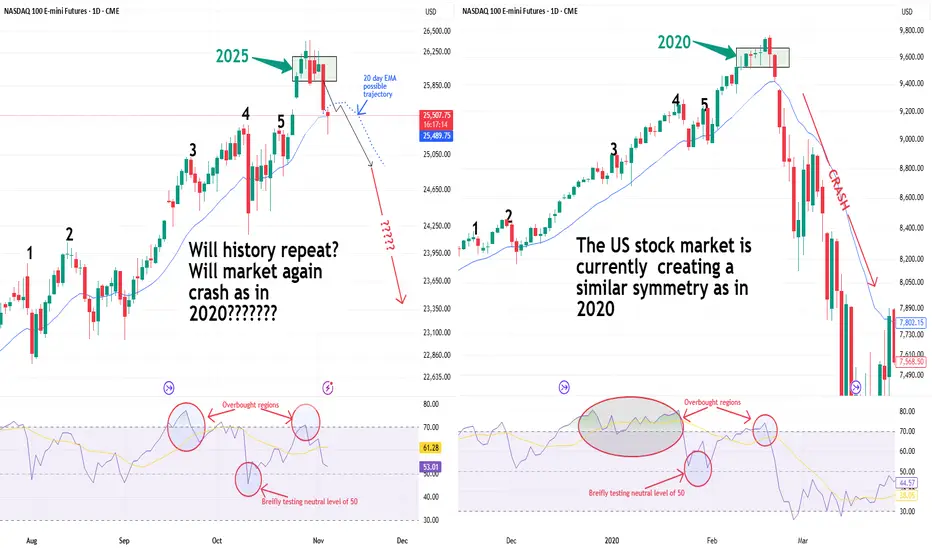
The NASDAQ 100 is creating a similar price action symmetry and RSI behavior to the pattern seen just before the 2020 crash.
* In 2020, this setup led to a sharp correction.
* In 2025, the symmetry looks almost identical.
Is it déjà vu — or just another pause before the next leg up?
* In 2020, this setup led to a sharp correction.
* In 2025, the symmetry looks almost identical.
Is it déjà vu — or just another pause before the next leg up?
Certified Market Technician
WA: +33755531401 +971545965565
marketinvestopedia.com/
WA: +33755531401 +971545965565
marketinvestopedia.com/
免責聲明
這些資訊和出版物並不意味著也不構成TradingView提供或認可的金融、投資、交易或其他類型的意見或建議。請在使用條款閱讀更多資訊。
Certified Market Technician
WA: +33755531401 +971545965565
marketinvestopedia.com/
WA: +33755531401 +971545965565
marketinvestopedia.com/
免責聲明
這些資訊和出版物並不意味著也不構成TradingView提供或認可的金融、投資、交易或其他類型的意見或建議。請在使用條款閱讀更多資訊。