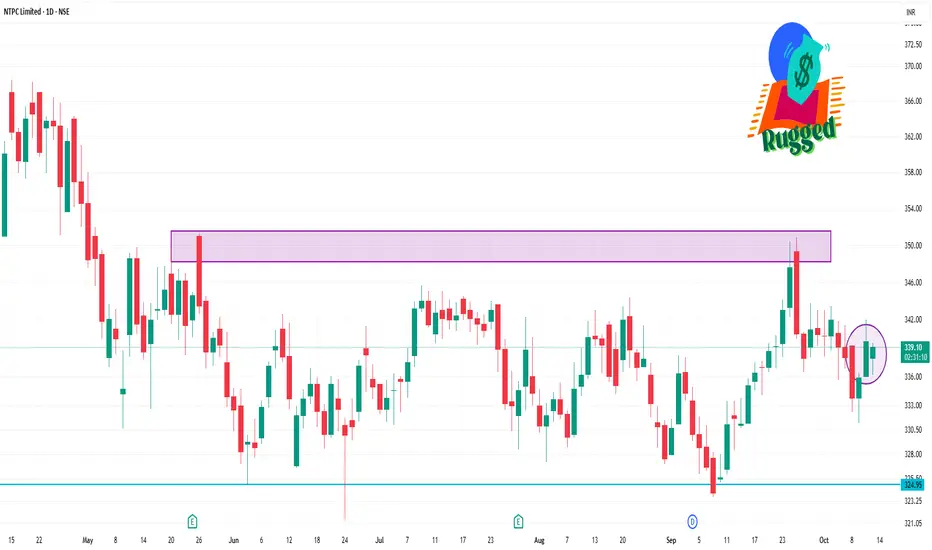
📈 Intraday Support & Resistance Levels
Immediate Support: ₹337.29
Immediate Resistance: ₹340.85
Key Pivot Point: ₹339.20
These levels are derived from standard pivot point calculations and are commonly used by traders for short-term strategies.
🔍 Technical Indicators
Relative Strength Index (RSI): 53.93 — indicating a neutral market condition.
Moving Average Convergence Divergence (MACD): 0.330 — suggesting a bullish trend.
5-Day Moving Average: ₹338.45 — supporting a bullish outlook.
50-Day Moving Average: ₹338.05 — reinforcing the bullish trend.
200-Day Moving Average: ₹336.12 — indicating long-term bullish sentiment.
相關出版品
免責聲明
這些資訊和出版物並非旨在提供,也不構成TradingView提供或認可的任何形式的財務、投資、交易或其他類型的建議或推薦。請閱讀使用條款以了解更多資訊。