NVIDIA continues to trade with strong bullish momentum, consolidating just under the $190 level — a critical resistance area backed by prior liquidity grabs and gamma resistance. Today’s price action shows tight coiling between $188 and $189.50, indicating a potential breakout setup for the next session.
Market Structure:
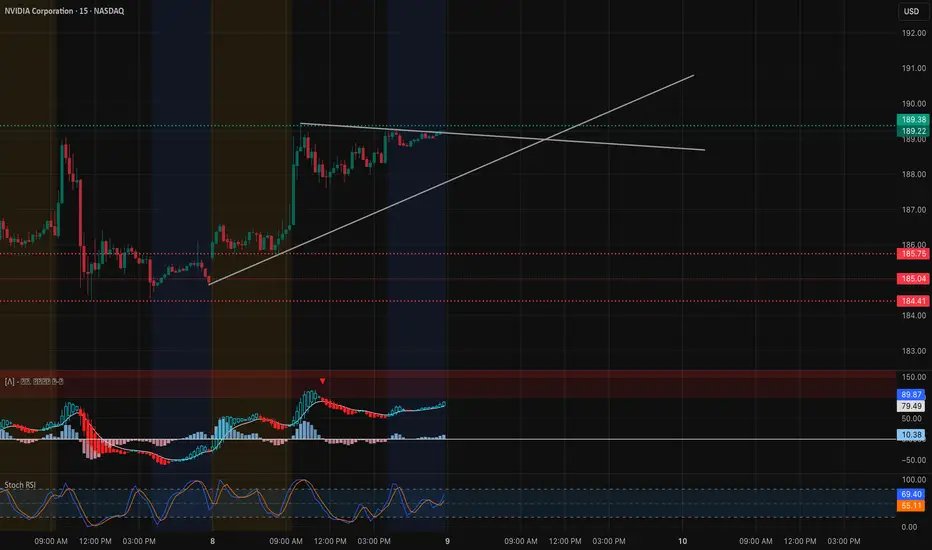
* On the 15-minute chart, NVDA is respecting an ascending trendline from yesterday’s low, suggesting sustained intraday bullish control.
* The 1-hour structure reveals a clean range between $185.75 (support) and $189.50 (resistance) — a breakout from this range could trigger a measured move toward $192–$195.
* MACD on the 15-minute is crossing bullish with rising histogram momentum, and the Stoch RSI remains elevated but not yet overextended — signaling possible continuation before cooling off.
Support and Resistance Levels:
* Immediate Resistance: $189.41 → $190.36 (short-term breakout zone)
* Major Resistance (Gamma Wall): $192.5 → $195
* Immediate Support: $186.89 → $185.75
* Key Support Zone: $184.4 → $182.8
GEX & Options Sentiment (1H GEX Chart):

* Highest positive Call Gamma concentration sits between $192.5 and $195, aligning with visible overhead resistance.
* Put support remains dense at $182–$180, forming a sturdy gamma floor.
* IVR remains low at 12.2, and call positioning slightly outweighs puts (13.5% call bias), showing traders are positioning bullish but cautiously.
* The GEX trend favors upside momentum while $185 holds, giving NVDA room to climb toward the $190–$192.5 zone if SPY continues to strengthen.
Trade Scenarios: Bullish Setup:
* Entry: Above $189.50 breakout confirmation
* Target 1: $192.5
* Target 2: $195
* Stop-Loss: Below $186.8
* Rationale: Trendline support, bullish MACD, and strong GEX alignment support a breakout continuation.
Bearish Setup:
* Entry: Below $185.75 (breakdown retest)
* Target 1: $184.4
* Target 2: $182
* Stop-Loss: Above $187
* Rationale: A rejection at $189–$190 with MACD divergence could trigger a short-term pullback to fill lower liquidity pockets.
NVDA’s price action shows controlled consolidation under a key resistance, suggesting a potential breakout continuation toward $192–$195 if momentum holds. Watch SPY’s direction for confirmation — any weakness there could cause NVDA to retest $185 before resuming upward. For now, bulls are in charge.
Disclaimer: This analysis is for educational purposes only and does not constitute financial advice. Always do your own research and manage your risk before trading.
Market Structure:
* On the 15-minute chart, NVDA is respecting an ascending trendline from yesterday’s low, suggesting sustained intraday bullish control.
* The 1-hour structure reveals a clean range between $185.75 (support) and $189.50 (resistance) — a breakout from this range could trigger a measured move toward $192–$195.
* MACD on the 15-minute is crossing bullish with rising histogram momentum, and the Stoch RSI remains elevated but not yet overextended — signaling possible continuation before cooling off.
Support and Resistance Levels:
* Immediate Resistance: $189.41 → $190.36 (short-term breakout zone)
* Major Resistance (Gamma Wall): $192.5 → $195
* Immediate Support: $186.89 → $185.75
* Key Support Zone: $184.4 → $182.8
GEX & Options Sentiment (1H GEX Chart):
* Highest positive Call Gamma concentration sits between $192.5 and $195, aligning with visible overhead resistance.
* Put support remains dense at $182–$180, forming a sturdy gamma floor.
* IVR remains low at 12.2, and call positioning slightly outweighs puts (13.5% call bias), showing traders are positioning bullish but cautiously.
* The GEX trend favors upside momentum while $185 holds, giving NVDA room to climb toward the $190–$192.5 zone if SPY continues to strengthen.
Trade Scenarios: Bullish Setup:
* Entry: Above $189.50 breakout confirmation
* Target 1: $192.5
* Target 2: $195
* Stop-Loss: Below $186.8
* Rationale: Trendline support, bullish MACD, and strong GEX alignment support a breakout continuation.
Bearish Setup:
* Entry: Below $185.75 (breakdown retest)
* Target 1: $184.4
* Target 2: $182
* Stop-Loss: Above $187
* Rationale: A rejection at $189–$190 with MACD divergence could trigger a short-term pullback to fill lower liquidity pockets.
NVDA’s price action shows controlled consolidation under a key resistance, suggesting a potential breakout continuation toward $192–$195 if momentum holds. Watch SPY’s direction for confirmation — any weakness there could cause NVDA to retest $185 before resuming upward. For now, bulls are in charge.
Disclaimer: This analysis is for educational purposes only and does not constitute financial advice. Always do your own research and manage your risk before trading.
免責聲明
這些資訊和出版物並不意味著也不構成TradingView提供或認可的金融、投資、交易或其他類型的意見或建議。請在使用條款閱讀更多資訊。
免責聲明
這些資訊和出版物並不意味著也不構成TradingView提供或認可的金融、投資、交易或其他類型的意見或建議。請在使用條款閱讀更多資訊。