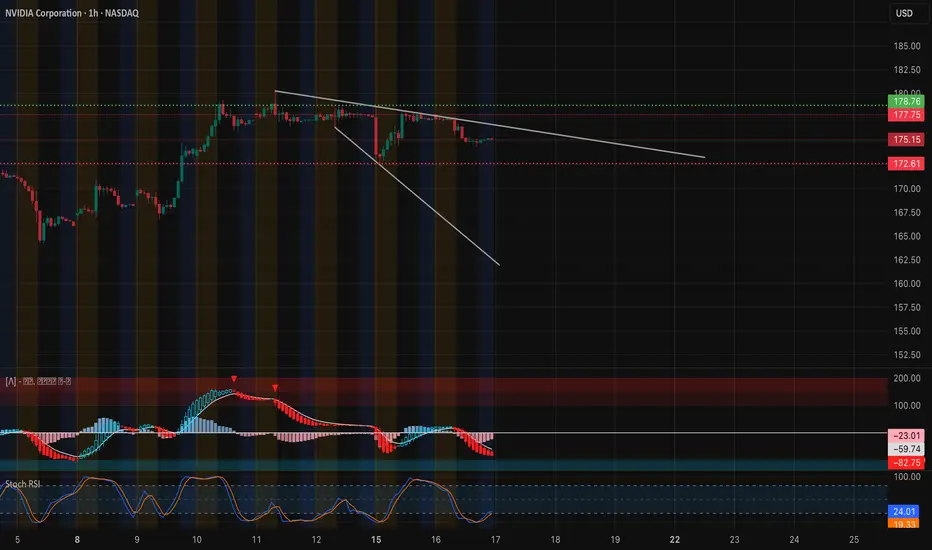
1-Hour Chart Technical View
Nvidia’s 1-hour chart shows clear short-term weakness. After failing near $182.5, price has been trending down and now hovers around $175.15. MACD remains deep in negative territory and Stoch RSI is oversold, hinting at potential for a short-term bounce but no confirmed reversal yet.
* Immediate Support: $172.5 (high-volume node and HVL 09/19)
* Secondary Support: $170 and $166.5
* Resistance: $177.7 and $182.5 are key overhead levels for any rebound
Price is trading under both 9 and 21 EMA, confirming a short-term bearish structure until a clean reclaim above $177.7.
GEX & Options Flow

Options positioning highlights mixed sentiment with cautious call interest:
* Call Walls: $177.5 (2nd call wall), $182.5 (highest positive NET GEX / gamma resistance), and $185.
* Put Walls: $170 and $165 (significant downside hedges).
* GEX Bias: Around 23.5% calls with IVR at 5.7 (IVx ~40.8). This relatively low IVR shows option premiums are moderate despite the pullback.
Dealers may support the $172.5 area, but below that, gamma exposure flips bearish and accelerates downside risk.
Trade Thoughts & Suggestions
* Swing Idea: Aggressive buyers can nibble near $172.5 with a tight stop below $170, aiming for a relief bounce to $177.7–$182.5.
* Scalp Idea: Short bounces into $177.7 resistance if momentum stays weak, or scalp quick long entries off a confirmed double-bottom near $172.5.
* Bearish Scenario: A decisive break under $170 could accelerate selling toward $166.5.
Quick Take
NVDA is in a corrective phase. For Sept 17, all eyes are on $172.5. Holding that level can spark an oversold bounce; losing it could open the door to deeper downside.
Disclaimer: This analysis is for educational purposes only and does not constitute financial advice. Always do your own research and manage risk before trading.
Nvidia’s 1-hour chart shows clear short-term weakness. After failing near $182.5, price has been trending down and now hovers around $175.15. MACD remains deep in negative territory and Stoch RSI is oversold, hinting at potential for a short-term bounce but no confirmed reversal yet.
* Immediate Support: $172.5 (high-volume node and HVL 09/19)
* Secondary Support: $170 and $166.5
* Resistance: $177.7 and $182.5 are key overhead levels for any rebound
Price is trading under both 9 and 21 EMA, confirming a short-term bearish structure until a clean reclaim above $177.7.
GEX & Options Flow
Options positioning highlights mixed sentiment with cautious call interest:
* Call Walls: $177.5 (2nd call wall), $182.5 (highest positive NET GEX / gamma resistance), and $185.
* Put Walls: $170 and $165 (significant downside hedges).
* GEX Bias: Around 23.5% calls with IVR at 5.7 (IVx ~40.8). This relatively low IVR shows option premiums are moderate despite the pullback.
Dealers may support the $172.5 area, but below that, gamma exposure flips bearish and accelerates downside risk.
Trade Thoughts & Suggestions
* Swing Idea: Aggressive buyers can nibble near $172.5 with a tight stop below $170, aiming for a relief bounce to $177.7–$182.5.
* Scalp Idea: Short bounces into $177.7 resistance if momentum stays weak, or scalp quick long entries off a confirmed double-bottom near $172.5.
* Bearish Scenario: A decisive break under $170 could accelerate selling toward $166.5.
Quick Take
NVDA is in a corrective phase. For Sept 17, all eyes are on $172.5. Holding that level can spark an oversold bounce; losing it could open the door to deeper downside.
Disclaimer: This analysis is for educational purposes only and does not constitute financial advice. Always do your own research and manage risk before trading.
免責聲明
這些資訊和出版物並不意味著也不構成TradingView提供或認可的金融、投資、交易或其他類型的意見或建議。請在使用條款閱讀更多資訊。
免責聲明
這些資訊和出版物並不意味著也不構成TradingView提供或認可的金融、投資、交易或其他類型的意見或建議。請在使用條款閱讀更多資訊。