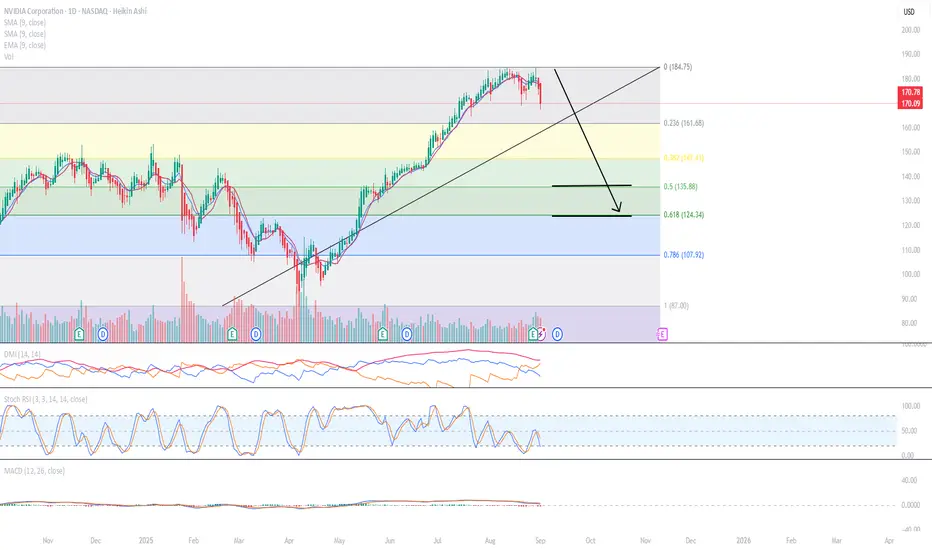
NVDA is continuing downward. I have the target as being around middle of October or later.
I used the Heikin Ashi candles:
1: They show more of a directional movement.
2: They tend to filter out the market noise, so you can see the direction better.
3: it reduces false signals, allowing you to stay in the trade longer.
4: And it also gives a smoother appearance making it easier to see the trends and reversals.
My stops are:
1) the high of the previous Heikin Ashi candlestick,
2) 2 green Heikin Ashi candlesticks,
3) a specific dollar amount for a total loss for my trade or
4) a specific dollar amount per contract.
If it hits one of those stops, I am out of my trade.
Typically, I would wait until there are 2 red daily Heikin Ashi candlesticks before entering which it has shown as of today.
I use the MacD, the Stock RSI and the DMI to assist me with the direction of the market. I am not perfect at them.
I personally find:
* the 5 minute indicators typically represents what will happen in the next half and hour.
* the 10 minute indicators typically represents what will happen in the next hour.
* the 30 minute indicators typically represents what will happen in the daily.
* and, the hour indicators typically represents what will happen in the next week.
If you look at the weekly indicators, they are bearish already which shows a longer term directional movement.
Trade at your own risk, make sure you have stops in place and only use 10% of your trading account, so that if you are wrong, you will not blow up your account.
Happy trading!
免責聲明
這些資訊和出版物並非旨在提供,也不構成TradingView提供或認可的任何形式的財務、投資、交易或其他類型的建議或推薦。請閱讀使用條款以了解更多資訊。
免責聲明
這些資訊和出版物並非旨在提供,也不構成TradingView提供或認可的任何形式的財務、投資、交易或其他類型的建議或推薦。請閱讀使用條款以了解更多資訊。