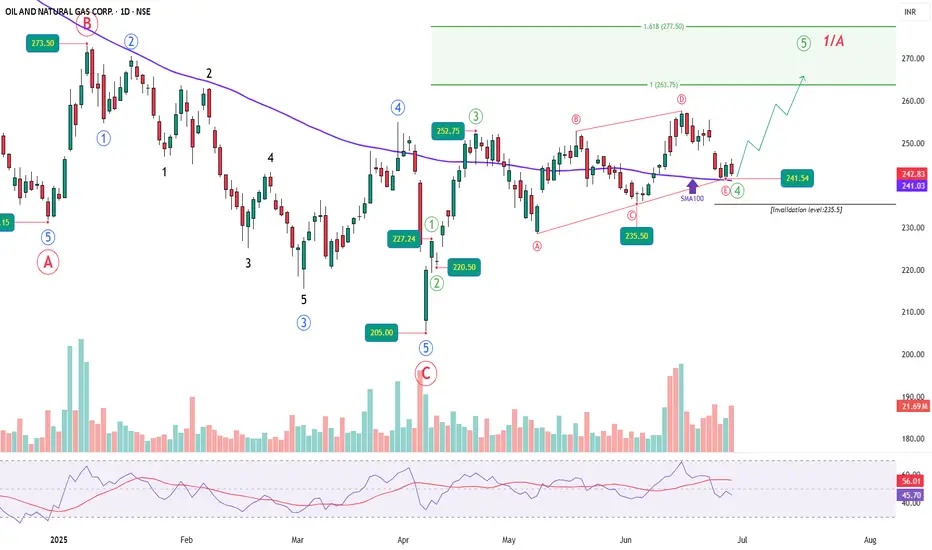
Following the completion of Wave 3 — an impulsive rally from the 205 low — ONGC entered what looks like a classic Wave 4 triangle. The internal structure — labeled A through E — unfolded in a controlled, converging fashion, respecting the triangle boundaries. Wave E recently ended near 241.54, right on top of the 100-day simple moving average, which has acted as dynamic support.
Interestingly, we saw strong volume come in during the rally into Wave D, indicating buying interest. This was followed by a period of low volume and sideways drift during Wave E, which fits the expected behavior for the final leg of a triangle. RSI also cooled off during this period, resetting from overbought levels, and currently hovers just below the 50 mark.
The invalidation for this triangle setup is placed below the Wave C low, around 235.5. A decisive break below this level would nullify the triangle structure and open the door for a deeper, more complex correction. But as long as price respects this zone and begins to push upward with volume, the case for a Wave 5 rally remains strong.
Fibonacci projections place the 100% extension of Wave 1 through 3 near 263.75 and the 1.618 extension near 277.50 — a likely zone for Wave 5 termination. If ONGC can break above the D-wave high with momentum, it may very well be headed toward those levels in the coming weeks.
WaveXplorer | Elliott Wave insights
📊 X profile: @veerappa89
📊 X profile: @veerappa89
免責聲明
這些資訊和出版物並非旨在提供,也不構成TradingView提供或認可的任何形式的財務、投資、交易或其他類型的建議或推薦。請閱讀使用條款以了解更多資訊。
WaveXplorer | Elliott Wave insights
📊 X profile: @veerappa89
📊 X profile: @veerappa89
免責聲明
這些資訊和出版物並非旨在提供,也不構成TradingView提供或認可的任何形式的財務、投資、交易或其他類型的建議或推薦。請閱讀使用條款以了解更多資訊。