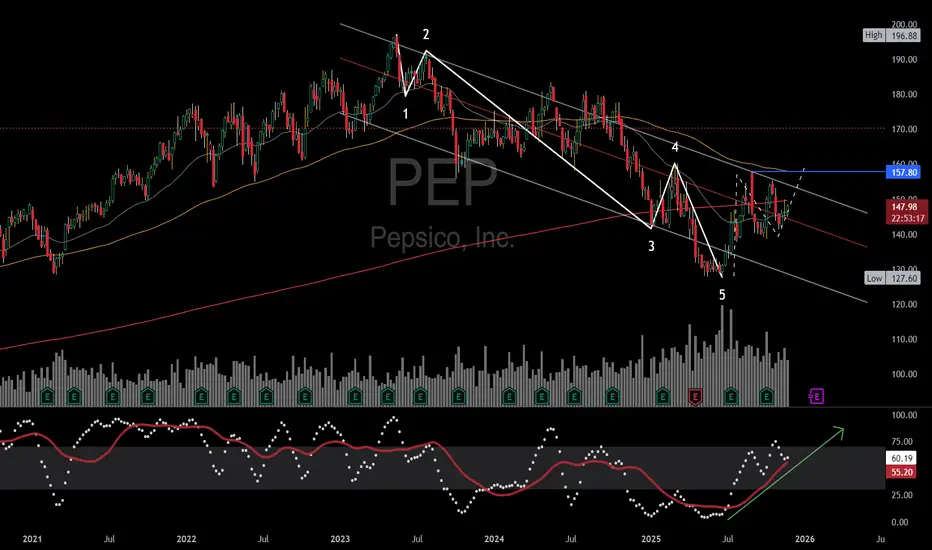
PepsiCo has been declining for the last 2 years. The impulse pattern down to a 5-year support level was influenced by higher interest rates; comparing PEP to the US10Y will show this relationship. I remember "Higher-for-longer" being the main idea behind the 3rd wave down, and we saw that pin, in the 5th wave, at a large support level with a strong reaction.
My initial thesis was $170 and I still believe that to be a large inflection point. I am looking for daily closings above the 157.8 pivot for a longer hold towards $170.
I added the Stochastic indicator to represent the divergence in price to momentum. Getting above the upper trend line (about $154) will open the door to the 120ema (sourcing the highs).
The 400sma (red line) shows the dominant trend is still upwards. Price has traded beneath this moving average for some time. It looks like a Head & Shoulders pattern is forming around this longer-term support level. A weekly close above the wave 4 pivot high can activate a thrust into the larger consolidated range.
2026 will prove to be an important year for cyclicals, in my estimation.
免責聲明
這些資訊和出版物並非旨在提供,也不構成TradingView提供或認可的任何形式的財務、投資、交易或其他類型的建議或推薦。請閱讀使用條款以了解更多資訊。
免責聲明
這些資訊和出版物並非旨在提供,也不構成TradingView提供或認可的任何形式的財務、投資、交易或其他類型的建議或推薦。請閱讀使用條款以了解更多資訊。