Testing the $616 Resistance Wall 🚀
📆 Daily Chart — Macro Structure and Market Context
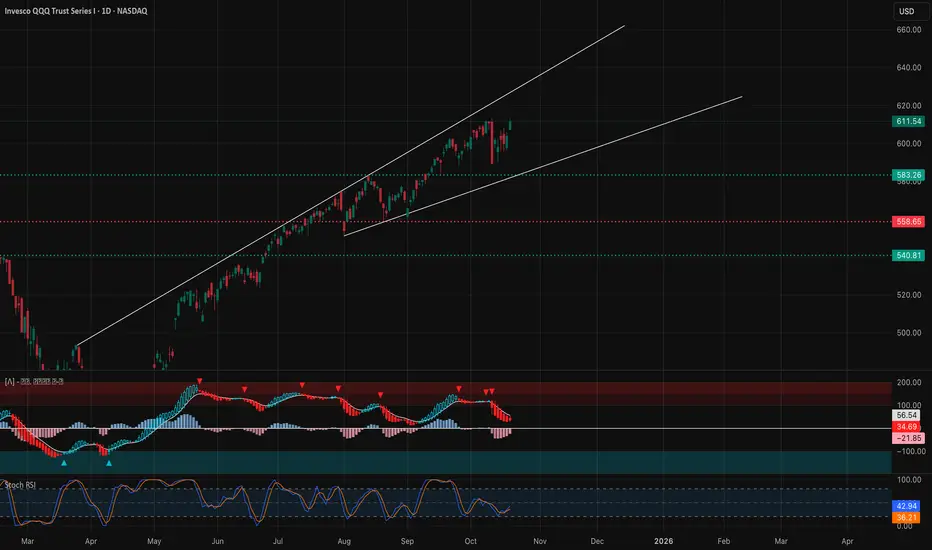
Market Structure: The NASDAQ ETF (QQQ) continues to ride a steady ascending channel since March, maintaining a higher-low structure. The recent CHoCH at $583 was followed by a rebound and BOS (Break of Structure) above $600, confirming that the pullback phase has likely completed.
Price is now pressing into the upper channel resistance near $611–$616, which coincides with heavy liquidity and prior supply zones. Despite the overhead resistance, the broader structure remains bullish, with price action consolidating in the upper half of the channel — a typical mid-trend continuation behavior.
Supply & Demand / Order Blocks:
* Demand Zone: $583–$590 (key defended base from last CHoCH).
* Mid-Demand Zone: $558–$560 (38% fib + historical OB).
* Supply Zone: $611–$616 (upper channel cap and recent BOS level).
Indicator Confluence:
* 9 EMA > 21 EMA: bullish alignment with widening slope.
* MACD: Momentum recovering from midline, histogram expanding positively.
* Stoch RSI: Mid-range reset around 43 — plenty of room to rise.
* Volume: Rising on breakout days, confirming accumulation.
The daily chart suggests a continuation setup with bullish pressure intact. As long as QQQ holds above $600, bulls control the trend toward $616–$620.
⏱️ 1-Hour Chart — Near-Term Trend and Swing Setup

Market Structure: The 1-hour view highlights a strong recovery leg after multiple CHoCH → BOS sequences. Price broke out of a descending wedge and reclaimed the $608–$610 level, a crucial pivot area aligned with gamma resistance.
Currently, QQQ is consolidating beneath the $612–$616 resistance wall. A clean breakout with volume could trigger a test of the upper trendline near $620.
Supply & Demand / OB Zones:
* Demand Zone: $605–$608 (retest area for dip buyers).
* Supply Zone: $612–$616 (active resistance zone).
Indicator Confluence:
* 9 EMA > 21 EMA: bull control intact.
* MACD: still strong, histogram shows gradual expansion.
* Stoch RSI: hovering near overbought but showing no divergence yet.
Trade Scenarios:
* Bullish Setup: Buy dips near $606–$608 → Target $616 / $620 → Stop $601.
* Bearish Setup: Short rejection at $616 → Target $605 / $600 → Stop $618.
A close above $616 opens the door for momentum continuation toward $622–$625, while losing $605 would likely trigger a retest of $590 demand.
🕒 15-Minute Chart — Intraday Scalping Structure

Market Structure: The 15-min chart reveals QQQ’s short-term compression after a morning rally. Price remains within a rising micro-channel but is stalling near resistance at $612–$614. Several BOS patterns confirm trend continuation, while the latest CHoCH at $611.3 marks minor cooling.
This looks like a controlled pullback rather than a reversal, with liquidity building around $610.
Supply & Demand / OB Levels:
* Demand Zone: $608–$610 (intraday support and EMA confluence).
* Supply Zone: $614–$616 (scalp resistance).
Indicator Confluence:
* 9 EMA vs 21 EMA: still trending upward but flattening slightly.
* MACD: weakening histogram — possible short-term cooldown.
* Stoch RSI: cycling down from overbought, indicating temporary pause.
Scalp Plan:
* Bullish Bias: Buy near $609–$610 → Target $614 → Stop $607.
* Bearish Bias: Short rejection from $614–$615 → Target $609 → Stop $616.
Expect small consolidation before breakout. Trend remains bullish until $608 breaks decisively.
📊 GEX (Gamma Exposure) & Options Sentiment

The GEX structure shows heavy call positioning at $612–$616, with a clear gamma ceiling near $616 — currently acting as resistance. Below $604 lies the highest liquidity void (HVL) where dealers might provide support.
Key GEX Levels:
* Highest Positive GEX / Call Wall: $616 (major gamma resistance).
* 2nd Call Wall: $613.
* Put Wall / Support: $604 and $593 (dealer hedging floors).
* IVR: 22.9 — low, suggesting compression and potential volatility pop.
* Put/Call Ratio: 48.5% puts — slightly bearish skew but stabilizing.
Dealers are in neutral gamma territory, meaning price may grind within $604–$616 until a breakout forces delta hedging momentum in either direction.
🎯 Closing Outlook
The broader QQQ structure remains bullish inside an uptrend channel, supported by strong demand zones and recovering momentum indicators. The short-term price action is coiling for a potential breakout above $616 — a key level to watch for momentum confirmation.
As long as QQQ holds above $605, the trend bias stays bullish toward $620–$625. If $604 breaks, expect a deeper pullback to $590 before buyers re-engage.
Disclaimer: This analysis is for educational purposes only and not financial advice. Always perform your own due diligence and manage your risk carefully.
📆 Daily Chart — Macro Structure and Market Context
Market Structure: The NASDAQ ETF (QQQ) continues to ride a steady ascending channel since March, maintaining a higher-low structure. The recent CHoCH at $583 was followed by a rebound and BOS (Break of Structure) above $600, confirming that the pullback phase has likely completed.
Price is now pressing into the upper channel resistance near $611–$616, which coincides with heavy liquidity and prior supply zones. Despite the overhead resistance, the broader structure remains bullish, with price action consolidating in the upper half of the channel — a typical mid-trend continuation behavior.
Supply & Demand / Order Blocks:
* Demand Zone: $583–$590 (key defended base from last CHoCH).
* Mid-Demand Zone: $558–$560 (38% fib + historical OB).
* Supply Zone: $611–$616 (upper channel cap and recent BOS level).
Indicator Confluence:
* 9 EMA > 21 EMA: bullish alignment with widening slope.
* MACD: Momentum recovering from midline, histogram expanding positively.
* Stoch RSI: Mid-range reset around 43 — plenty of room to rise.
* Volume: Rising on breakout days, confirming accumulation.
The daily chart suggests a continuation setup with bullish pressure intact. As long as QQQ holds above $600, bulls control the trend toward $616–$620.
⏱️ 1-Hour Chart — Near-Term Trend and Swing Setup
Market Structure: The 1-hour view highlights a strong recovery leg after multiple CHoCH → BOS sequences. Price broke out of a descending wedge and reclaimed the $608–$610 level, a crucial pivot area aligned with gamma resistance.
Currently, QQQ is consolidating beneath the $612–$616 resistance wall. A clean breakout with volume could trigger a test of the upper trendline near $620.
Supply & Demand / OB Zones:
* Demand Zone: $605–$608 (retest area for dip buyers).
* Supply Zone: $612–$616 (active resistance zone).
Indicator Confluence:
* 9 EMA > 21 EMA: bull control intact.
* MACD: still strong, histogram shows gradual expansion.
* Stoch RSI: hovering near overbought but showing no divergence yet.
Trade Scenarios:
* Bullish Setup: Buy dips near $606–$608 → Target $616 / $620 → Stop $601.
* Bearish Setup: Short rejection at $616 → Target $605 / $600 → Stop $618.
A close above $616 opens the door for momentum continuation toward $622–$625, while losing $605 would likely trigger a retest of $590 demand.
🕒 15-Minute Chart — Intraday Scalping Structure
Market Structure: The 15-min chart reveals QQQ’s short-term compression after a morning rally. Price remains within a rising micro-channel but is stalling near resistance at $612–$614. Several BOS patterns confirm trend continuation, while the latest CHoCH at $611.3 marks minor cooling.
This looks like a controlled pullback rather than a reversal, with liquidity building around $610.
Supply & Demand / OB Levels:
* Demand Zone: $608–$610 (intraday support and EMA confluence).
* Supply Zone: $614–$616 (scalp resistance).
Indicator Confluence:
* 9 EMA vs 21 EMA: still trending upward but flattening slightly.
* MACD: weakening histogram — possible short-term cooldown.
* Stoch RSI: cycling down from overbought, indicating temporary pause.
Scalp Plan:
* Bullish Bias: Buy near $609–$610 → Target $614 → Stop $607.
* Bearish Bias: Short rejection from $614–$615 → Target $609 → Stop $616.
Expect small consolidation before breakout. Trend remains bullish until $608 breaks decisively.
📊 GEX (Gamma Exposure) & Options Sentiment
The GEX structure shows heavy call positioning at $612–$616, with a clear gamma ceiling near $616 — currently acting as resistance. Below $604 lies the highest liquidity void (HVL) where dealers might provide support.
Key GEX Levels:
* Highest Positive GEX / Call Wall: $616 (major gamma resistance).
* 2nd Call Wall: $613.
* Put Wall / Support: $604 and $593 (dealer hedging floors).
* IVR: 22.9 — low, suggesting compression and potential volatility pop.
* Put/Call Ratio: 48.5% puts — slightly bearish skew but stabilizing.
Dealers are in neutral gamma territory, meaning price may grind within $604–$616 until a breakout forces delta hedging momentum in either direction.
🎯 Closing Outlook
The broader QQQ structure remains bullish inside an uptrend channel, supported by strong demand zones and recovering momentum indicators. The short-term price action is coiling for a potential breakout above $616 — a key level to watch for momentum confirmation.
As long as QQQ holds above $605, the trend bias stays bullish toward $620–$625. If $604 breaks, expect a deeper pullback to $590 before buyers re-engage.
Disclaimer: This analysis is for educational purposes only and not financial advice. Always perform your own due diligence and manage your risk carefully.
免責聲明
這些資訊和出版物並非旨在提供,也不構成TradingView提供或認可的任何形式的財務、投資、交易或其他類型的建議或推薦。請閱讀使用條款以了解更多資訊。
免責聲明
這些資訊和出版物並非旨在提供,也不構成TradingView提供或認可的任何形式的財務、投資、交易或其他類型的建議或推薦。請閱讀使用條款以了解更多資訊。