Detailed Market Structure Breakdown
4-Hour Chart (Macro Trend)
Structure: The Sensex is in an accelerated corrective phase, trading within a steep descending channel. The price broke below the 81,800 and 81,000 supports and is now testing the key macro demand zone around 80,400 - 80,600. This area is a significant Bullish Order Block (OB) and a vital horizontal support.
Key Levels:
Major Supply (Resistance): 81,000 - 81,200. This previous support is now the crucial overhead resistance, aligning with the upper boundary of the descending channel.
Major Demand (Support): 80,400 - 80,600. This is the key "line in the sand." A sustained breakdown below 80,300 would signal a deeper correction toward 79,500.
Outlook: The bearish pressure has paused, and the market is attempting to stabilize at a key support. This indicates a potential range-bound trade or a technical bounce.
1-Hour Chart (Intermediate View)
Structure: The 1H chart is strongly bearish, confined to a descending channel. Monday's session saw the price attempt to break below the lower trendline of the channel but failed, resulting in a Doji-like or consolidation candle right on the 80,400 support. This suggests buyers are defending this area.
Key Levels:
Immediate Resistance: The upper trendline of the descending channel, currently near 80,750 - 80,800.
Immediate Support: 80,300. This is the lower boundary of the current demand zone.
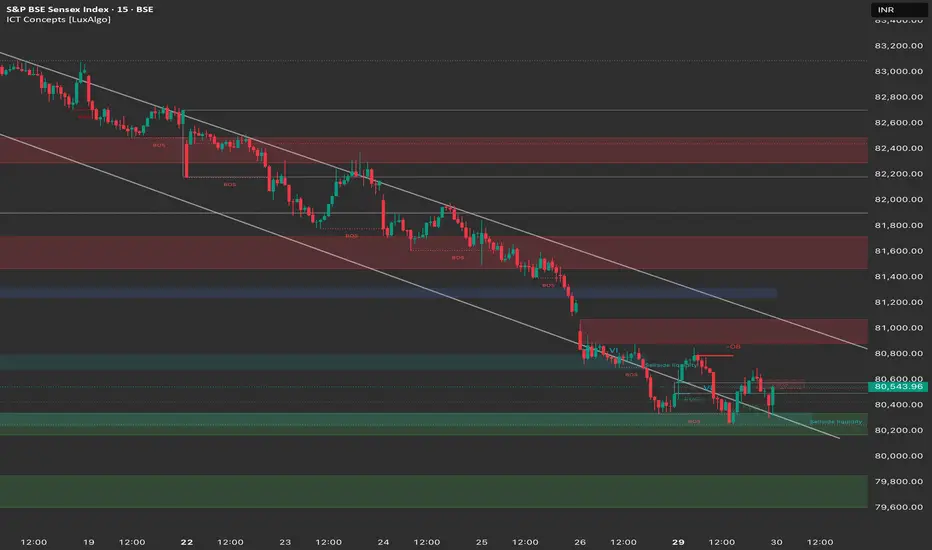
15-Minute Chart (Intraday View)
Structure: The 15M chart shows clear consolidation, marked by a tight, sideways movement following the initial morning move. The price made a BOS on the downside but quickly recovered, and is now trading around a minor Order Block (OB) and FVG (Fair Value Gap).
Key Levels:
Intraday Supply: 80,800. This is the high of the recent small consolidation and the immediate resistance.
Intraday Demand: 80,300. The crucial support for the open.
Outlook: Neutral-to-Bullish for the session open, focused on a breakout from the tight consolidation.
Trade Plan (Tuesday, 30th September)
Market Outlook: Sensex is at a major support level. The strategy is to be reactive, waiting for a break of the tight consolidation boundaries.
Bullish Scenario (Reversal/Bounce Plan)
Justification: The strong defense of the 80,400 support and the recovery from the day's low suggest a potential short-covering rally.
Entry: Long entry on a decisive break and 15-minute candle close above 80,800 (breaking the recent consolidation high).
Stop Loss (SL): Below 80,400.
Targets:
T1: 81,000 (Psychological/Channel Resistance).
T2: 81,200 (Previous support/FVG zone).
T3: 81,600 (Major supply zone).
Bearish Scenario (Continuation Plan)
Justification: The continuation of the strong bearish trend following the breakdown of previous structure.
Entry: Short entry on a decisive break and 15-minute candle close below 80,300.
Stop Loss (SL): Place a stop loss above 80,550.
Targets:
T1: 80,000 (Psychological support).
T2: 79,500 - 79,700 (Major 4H demand zone).
Key Levels for Observation:
Immediate Decision Point: The 80,300 - 80,800 zone.
Bearish Confirmation: A break and sustained move below 80,300.
Bullish Confirmation: A recapture of the 80,800 level.
Line in the Sand: 80,300. The market remains under strong bearish pressure below this level.
4-Hour Chart (Macro Trend)
Structure: The Sensex is in an accelerated corrective phase, trading within a steep descending channel. The price broke below the 81,800 and 81,000 supports and is now testing the key macro demand zone around 80,400 - 80,600. This area is a significant Bullish Order Block (OB) and a vital horizontal support.
Key Levels:
Major Supply (Resistance): 81,000 - 81,200. This previous support is now the crucial overhead resistance, aligning with the upper boundary of the descending channel.
Major Demand (Support): 80,400 - 80,600. This is the key "line in the sand." A sustained breakdown below 80,300 would signal a deeper correction toward 79,500.
Outlook: The bearish pressure has paused, and the market is attempting to stabilize at a key support. This indicates a potential range-bound trade or a technical bounce.
1-Hour Chart (Intermediate View)
Structure: The 1H chart is strongly bearish, confined to a descending channel. Monday's session saw the price attempt to break below the lower trendline of the channel but failed, resulting in a Doji-like or consolidation candle right on the 80,400 support. This suggests buyers are defending this area.
Key Levels:
Immediate Resistance: The upper trendline of the descending channel, currently near 80,750 - 80,800.
Immediate Support: 80,300. This is the lower boundary of the current demand zone.
15-Minute Chart (Intraday View)
Structure: The 15M chart shows clear consolidation, marked by a tight, sideways movement following the initial morning move. The price made a BOS on the downside but quickly recovered, and is now trading around a minor Order Block (OB) and FVG (Fair Value Gap).
Key Levels:
Intraday Supply: 80,800. This is the high of the recent small consolidation and the immediate resistance.
Intraday Demand: 80,300. The crucial support for the open.
Outlook: Neutral-to-Bullish for the session open, focused on a breakout from the tight consolidation.
Trade Plan (Tuesday, 30th September)
Market Outlook: Sensex is at a major support level. The strategy is to be reactive, waiting for a break of the tight consolidation boundaries.
Bullish Scenario (Reversal/Bounce Plan)
Justification: The strong defense of the 80,400 support and the recovery from the day's low suggest a potential short-covering rally.
Entry: Long entry on a decisive break and 15-minute candle close above 80,800 (breaking the recent consolidation high).
Stop Loss (SL): Below 80,400.
Targets:
T1: 81,000 (Psychological/Channel Resistance).
T2: 81,200 (Previous support/FVG zone).
T3: 81,600 (Major supply zone).
Bearish Scenario (Continuation Plan)
Justification: The continuation of the strong bearish trend following the breakdown of previous structure.
Entry: Short entry on a decisive break and 15-minute candle close below 80,300.
Stop Loss (SL): Place a stop loss above 80,550.
Targets:
T1: 80,000 (Psychological support).
T2: 79,500 - 79,700 (Major 4H demand zone).
Key Levels for Observation:
Immediate Decision Point: The 80,300 - 80,800 zone.
Bearish Confirmation: A break and sustained move below 80,300.
Bullish Confirmation: A recapture of the 80,800 level.
Line in the Sand: 80,300. The market remains under strong bearish pressure below this level.
免責聲明
這些資訊和出版物並不意味著也不構成TradingView提供或認可的金融、投資、交易或其他類型的意見或建議。請在使用條款閱讀更多資訊。
免責聲明
這些資訊和出版物並不意味著也不構成TradingView提供或認可的金融、投資、交易或其他類型的意見或建議。請在使用條款閱讀更多資訊。