WATCHING  SQ for 192- Analysis & Key levels
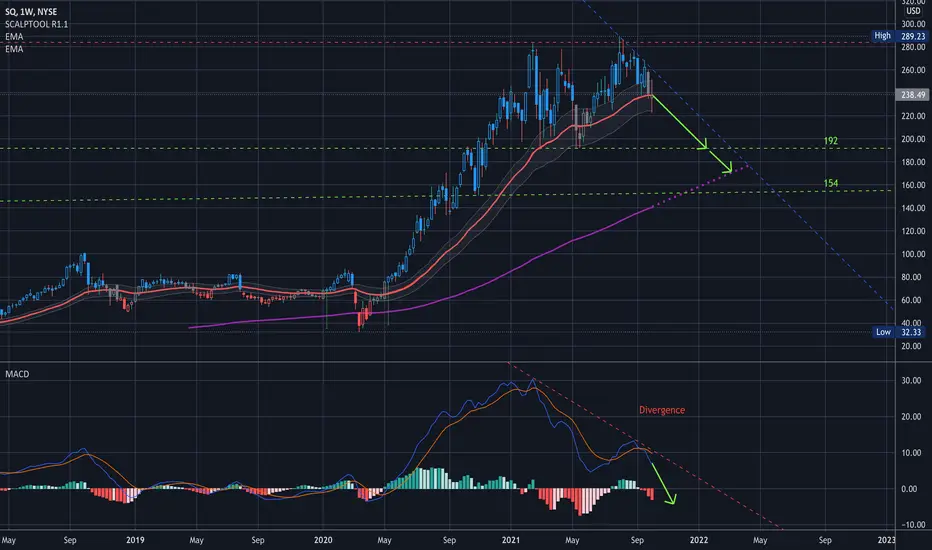
There is lots of bearishness happening in this chart on a larger scale. SQ was rejected at the resistance at 290 and has travelled back down toward the 50MA… and even though it did bounce off of it, I believe there are enough bearish technicals to bring this under and toward correction territory.
The Weekly MacD is still positive, but falling. A break below the centerline would be a signal of a much larger corrective move.
Currently no position, but watching for entry.
——————
I am not your financial advisor, but I will happily answer questions and analyze to the best of my ability but ultimately the risk is on you.
My average is in Grey
Red = Resistance
Green = Support
Blue = trendlines
If you want me to analyze any stock or ETF just leave me a comment and I’ll do it if I can.
Have fun, y’all!!
免責聲明
這些資訊和出版物並非旨在提供,也不構成TradingView提供或認可的任何形式的財務、投資、交易或其他類型的建議或推薦。請閱讀使用條款以了解更多資訊。
免責聲明
這些資訊和出版物並非旨在提供,也不構成TradingView提供或認可的任何形式的財務、投資、交易或其他類型的建議或推薦。請閱讀使用條款以了解更多資訊。