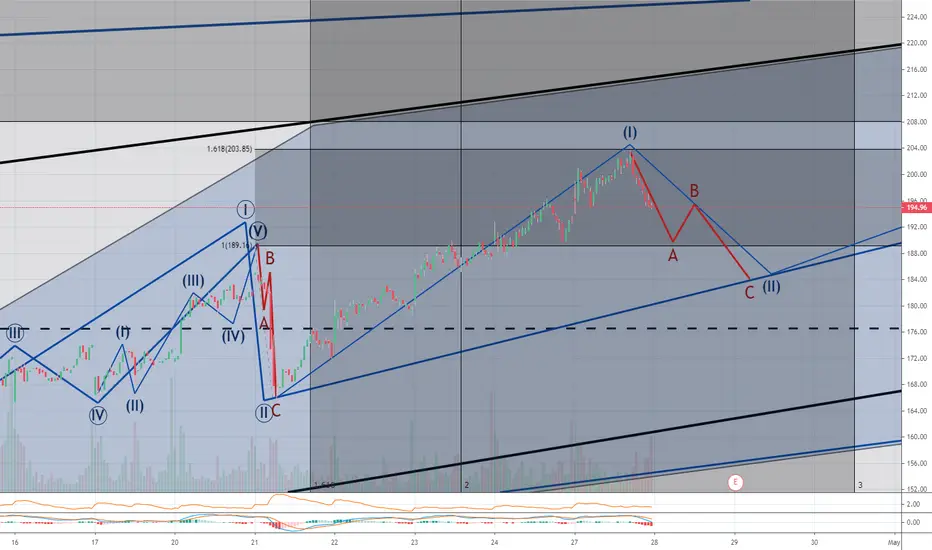
Short term bearish move followed by a bullish move up. Great opportunity to buy the dip as this short term move down is now here. These colored lines (Green = Bullish, Red=Bearish, Black=Long term wave count directional bias) represent the general predictive direction of the underlying security. Sometimes I also use them as trend lines and sometimes I do not. Please watch out for that. If you have any questions in how to interpret these charts, please let me know.
免責聲明
這些資訊和出版物並不意味著也不構成TradingView提供或認可的金融、投資、交易或其他類型的意見或建議。請在使用條款閱讀更多資訊。
免責聲明
這些資訊和出版物並不意味著也不構成TradingView提供或認可的金融、投資、交易或其他類型的意見或建議。請在使用條款閱讀更多資訊。