TEXRAIL: Elliott Wave Analysis - Weekly Chart
Source: LiveTradingBox | Chart Date: March 18, 2023
Overview
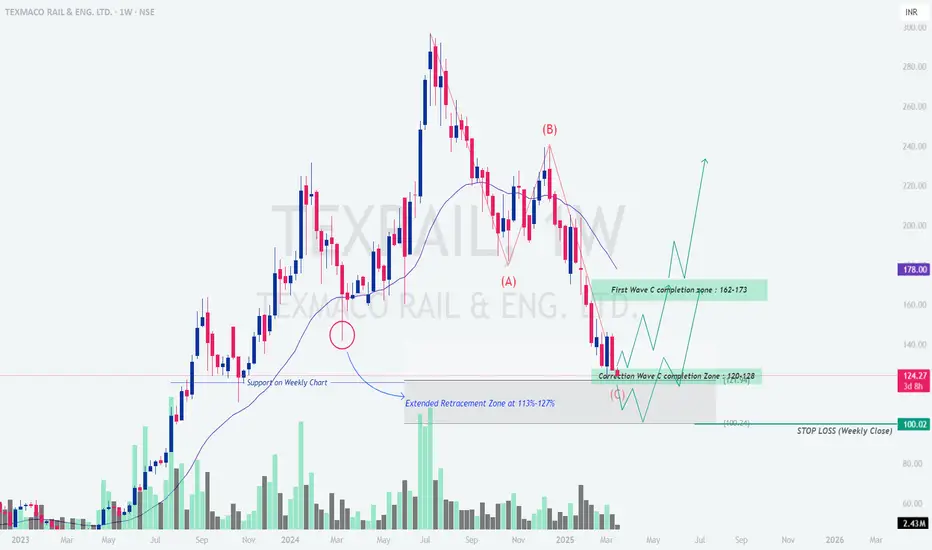
Texmaco Rail & Engineering Ltd. (TEXRAIL) rallied from 60 INR (early 2023) to 280 INR (mid-2024), a 366% gain, but has corrected to 124.27 INR. Using Elliott Wave and Fibonacci, this analysis projects the next moves.
Elliott Wave Outlook
- [] Wave (A): Decline from 280 INR to 124 INR (complete).
[] Wave (B): Counter-trend rally expected to 162–173 INR ("First Wave C completion zone"). - Wave (C): Final decline projected to 120–128 INR ("Correction Wave C completion zone").
Key Levels
- [] Resistance: 162–173 INR (Wave (B) target).
[] Support: 120–128 INR (Wave (C) target); 100.74 INR (stop loss on weekly close). - Fibonacci: 162–173 INR aligns with 23.6%–38.2% retracement of Wave (A); 120–128 INR matches 113%–127% extension.
Price Action & Volume
- [] Stock consolidating near 124 INR with smaller candlesticks, indicating indecision.
[] Volume decreasing, suggesting a potential reversal or continuation.
Trading Strategy
- [] Bullish (Wave (B)):
- [] Buy on confirmation above 128 INR.
[] Target: 162–173 INR.
[] Stop Loss: Below 100.74 INR (weekly close).
[] R:R ≈ 1.63:1.
- [] Short below 120 INR.
[] Target: 100.74 INR. - Stop: Above 128 INR.
- [] Buy on confirmation above 128 INR.
Conclusion
TEXRAIL is in a corrective ABC pattern. Expect a Wave (B) rally to 162–173 INR, followed by a Wave (C) decline to 120–128 INR. A weekly close below 100.74 INR turns the outlook bearish. Monitor price action and manage risk.
Disclaimer: For educational purposes only. Trading involves risks; do your own research.
免責聲明
這些資訊和出版物並不意味著也不構成TradingView提供或認可的金融、投資、交易或其他類型的意見或建議。請在使用條款閱讀更多資訊。
免責聲明
這些資訊和出版物並不意味著也不構成TradingView提供或認可的金融、投資、交易或其他類型的意見或建議。請在使用條款閱讀更多資訊。