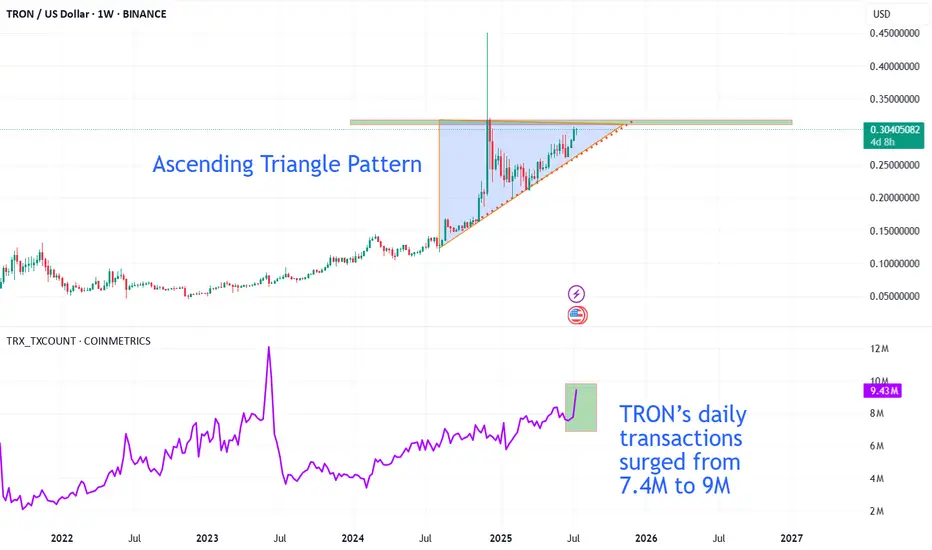
The TRX/USDT weekly chart is showing TRON testing a major resistance zone near $0.32, while forming a classic ascending triangle pattern just below this level. This bullish structure typically signals increasing momentum from buyers and raises the potential for a breakout above resistance.
What makes the bullish case even more compelling is the strong on-chain activity. According to Cryptoonchain (using CryptoQuant data), daily transactions on the TRON network have surged above 9 million, with the 100-day moving average also hovering close to its all-time highs. This significant growth reflects not only rising user engagement but also a sustained demand for network utility. Historically, sharp increases in on-chain activity have often fueled major price moves, especially when combined with clear bullish technical charts.
If TRX can achieve a decisive breakout above the $0.32 resistance with meaningful trading volume, a new bullish phase could be triggered in the medium term. However, traders should be cautious about the potential for fake-outs or temporary pullbacks after the first breakout.
Summary:
A combination of the ascending triangle formation and record-high on-chain activity (as reported by Cryptoonchain with CryptoQuant data) noticeably increases the odds of a successful breakout for TRON. Still, true confirmation relies on a clear, sustained close above the $0.32 level.
免責聲明
這些資訊和出版物並非旨在提供,也不構成TradingView提供或認可的任何形式的財務、投資、交易或其他類型的建議或推薦。請閱讀使用條款以了解更多資訊。
免責聲明
這些資訊和出版物並非旨在提供,也不構成TradingView提供或認可的任何形式的財務、投資、交易或其他類型的建議或推薦。請閱讀使用條款以了解更多資訊。