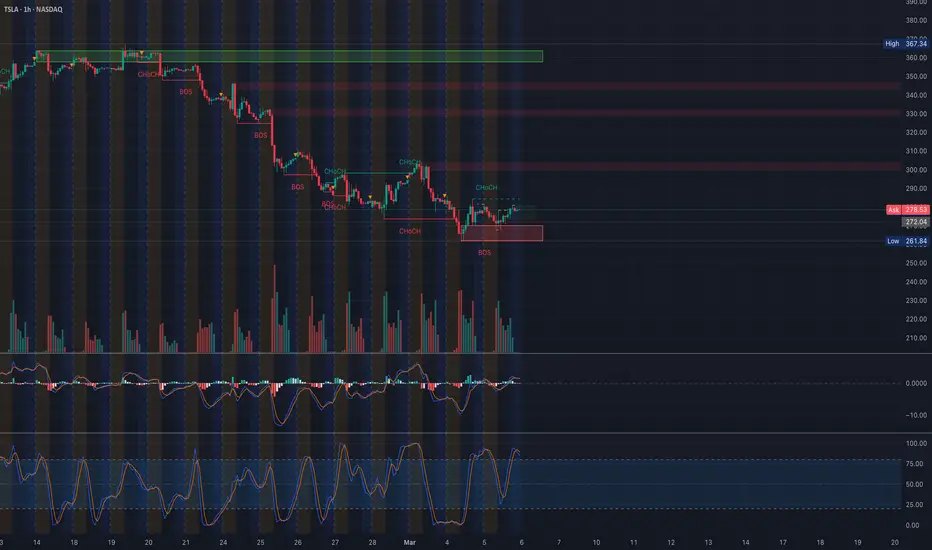
Market Structure & Key Levels
* Current Price: $278.53
* Support: $265, $250
* Resistance: $292.5, $300, $310
TSLA has recently rebounded from a demand zone around $265, showing early signs of a potential reversal. Multiple Change of Character (ChoCH) shifts indicate a possible transition from a bearish to a bullish market structure.
Reversal Zone Analysis
TSLA has entered a potential reversal zone between $278 - $292.5. If price sustains above $278, upside momentum toward $300 and $310 could unfold. A failure to hold $278 could send it back to retest the $265 support level.
Options & GEX Analysis

* IVR: 84.1
* IVx Avg: 80.3
* GEX: Green (bullish positioning)
* Put Walls: $265, $250
* Call Walls: $292.5, $300, $310
Options flow indicates bullish sentiment, with increasing call interest above $292.5 and strong put support at $265.
Trading Plan & Strategy
Bullish Scenario (Preferred)
* Entry: Above $278 with strong volume confirmation
* Target: $292.5, then $300
* Stop-Loss: Below $272
Bearish Scenario (Less Likely)
* Entry: If price rejects the $292.5 - $300 zone
* Target: $265
* Stop-Loss: Above $295
Options Trade Idea
* Bull Call Spread: Buy $280 Calls, Sell $300 Calls (April Expiry)
* Credit Put Spread: Sell $270 Puts, Buy $260 Puts
Final Thoughts
TSLA is showing early signs of a reversal, but needs to hold above $278 for confirmation. Watch for strength toward $292.5 and $300. If price struggles at resistance, a retest of $265 is possible.
Disclaimer:
This analysis is for educational purposes only and not financial advice. Please do your own research and manage risk accordingly.
* Current Price: $278.53
* Support: $265, $250
* Resistance: $292.5, $300, $310
TSLA has recently rebounded from a demand zone around $265, showing early signs of a potential reversal. Multiple Change of Character (ChoCH) shifts indicate a possible transition from a bearish to a bullish market structure.
Reversal Zone Analysis
TSLA has entered a potential reversal zone between $278 - $292.5. If price sustains above $278, upside momentum toward $300 and $310 could unfold. A failure to hold $278 could send it back to retest the $265 support level.
Options & GEX Analysis
* IVR: 84.1
* IVx Avg: 80.3
* GEX: Green (bullish positioning)
* Put Walls: $265, $250
* Call Walls: $292.5, $300, $310
Options flow indicates bullish sentiment, with increasing call interest above $292.5 and strong put support at $265.
Trading Plan & Strategy
Bullish Scenario (Preferred)
* Entry: Above $278 with strong volume confirmation
* Target: $292.5, then $300
* Stop-Loss: Below $272
Bearish Scenario (Less Likely)
* Entry: If price rejects the $292.5 - $300 zone
* Target: $265
* Stop-Loss: Above $295
Options Trade Idea
* Bull Call Spread: Buy $280 Calls, Sell $300 Calls (April Expiry)
* Credit Put Spread: Sell $270 Puts, Buy $260 Puts
Final Thoughts
TSLA is showing early signs of a reversal, but needs to hold above $278 for confirmation. Watch for strength toward $292.5 and $300. If price struggles at resistance, a retest of $265 is possible.
Disclaimer:
This analysis is for educational purposes only and not financial advice. Please do your own research and manage risk accordingly.
免責聲明
這些資訊和出版物並不意味著也不構成TradingView提供或認可的金融、投資、交易或其他類型的意見或建議。請在使用條款閱讀更多資訊。
免責聲明
這些資訊和出版物並不意味著也不構成TradingView提供或認可的金融、投資、交易或其他類型的意見或建議。請在使用條款閱讀更多資訊。