Oil analysis for the week.
“Oil - USOIL”
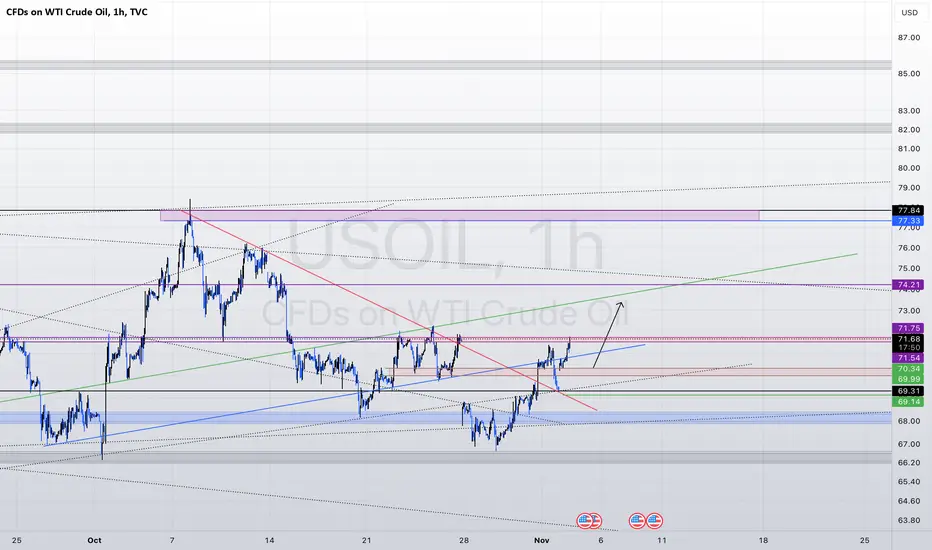
At the last high reached by oil prices at 78.40 dollars per barrel, a 61.8% upward correction occurred according to the Fibonacci sequence, which is more than enough to start a downward impulse and was already by nearly a thousand pips, and the movement continued after that in a wobbly manner until a Trendline or upper wedge was formed for the descending corrective channel, so we notice in the picture the presence of the level in red, which was the closing of last week, and thus there was a bullish price gap at the opening.
Thus, there was an upward gap at the opening. Now the price is at 71.70
We expect the upward movement to touch the green-colored sub-trendline area and expect a simple tail above the target of 74.21
It is also possible to continue it to the fictitious line level at about 74.75.
From there, a corrective move down.
This and God knows best.
免責聲明
這些資訊和出版物並不意味著也不構成TradingView提供或認可的金融、投資、交易或其他類型的意見或建議。請在使用條款閱讀更多資訊。