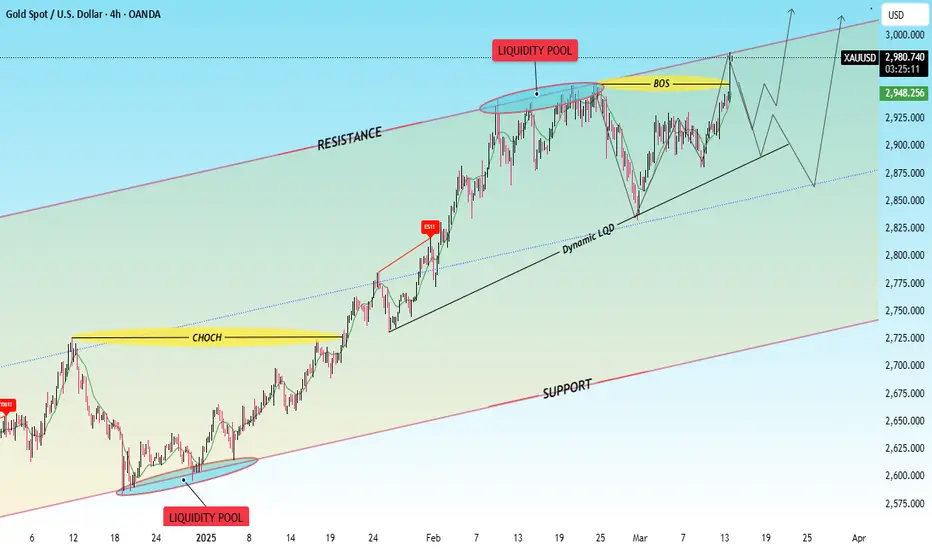
## *Pattern Identified:*
1. *Ascending Channel Pattern (Trend Channel)*
- The price is moving within a well-defined *support and resistance channel* (marked in purple).
- The market is in an *uptrend, respecting both the **support trendline* and *resistance trendline*.
### *Technical Tools Used:*
1. *Break of Structure (BOS)*
- Marked in yellow, indicating a breakout of the previous price structure.
- This confirms bullish momentum and trend continuation.
2. *Change of Character (CHOCH)*
- Found earlier in the trend, signaling a shift from a downtrend to an uptrend.
- This acts as an early signal for trend reversal or breakout traders.
3. *Liquidity Pools*
- *Lower Liquidity Pool (Pink Box): Located near the **support area*, showing a region where stop losses and buy orders may have been triggered.
- *Upper Liquidity Pool (Blue Box): Near the **resistance line*, indicating potential liquidity hunting before a breakout or reversal.
4. *Dynamic Liquidity (LQD) Line*
- A mid-level trendline that price seems to be respecting, acting as a dynamic support.
5. *Support & Resistance Levels*
- *Support (Lower Purple Line)*: The price has bounced multiple times from this level.
- *Resistance (Upper Purple Line)*: The price is approaching this area, with projections for possible breakouts or pullbacks.
6. *Projected Price Movements*
- Future price movements are marked with *zigzag lines, showing a **possible breakout above resistance* or a *retracement before further continuation*.
### *Conclusion:*
- The market is in a *bullish trend within an ascending channel*.
- If price *breaks above resistance, it could continue rising towards *$3,000**.
- However, if it *fails to break*, a pullback to the dynamic liquidity zone or support could occur before another attempt.
Would you like a more detailed breakdown of any of these concepts?
t.me/Xauusdanalysischartexperts
I deliver high-quality of forex signals and expert premium analysis updates, backed by meticulous analysis tools. and a commitment to exceptional results.
t.me/Xauusdanalysischartexperts
I deliver high-quality of forex signals and expert premium analysis updates, backed by meticulous analysis tools. and a commitment to exceptional results.
t.me/Xauusdanalysischartexperts
免責聲明
這些資訊和出版物並不意味著也不構成TradingView提供或認可的金融、投資、交易或其他類型的意見或建議。請在使用條款閱讀更多資訊。
t.me/Xauusdanalysischartexperts
I deliver high-quality of forex signals and expert premium analysis updates, backed by meticulous analysis tools. and a commitment to exceptional results.
t.me/Xauusdanalysischartexperts
I deliver high-quality of forex signals and expert premium analysis updates, backed by meticulous analysis tools. and a commitment to exceptional results.
t.me/Xauusdanalysischartexperts
免責聲明
這些資訊和出版物並不意味著也不構成TradingView提供或認可的金融、投資、交易或其他類型的意見或建議。請在使用條款閱讀更多資訊。