daily chart clearly show sell , we have 2 trend line in down , technical say if dowjones can break them ,down trend will start ,can go to 28500 (big gap on cash phisical dowjones)
tradingview.com/chart/jtsoM2GC/
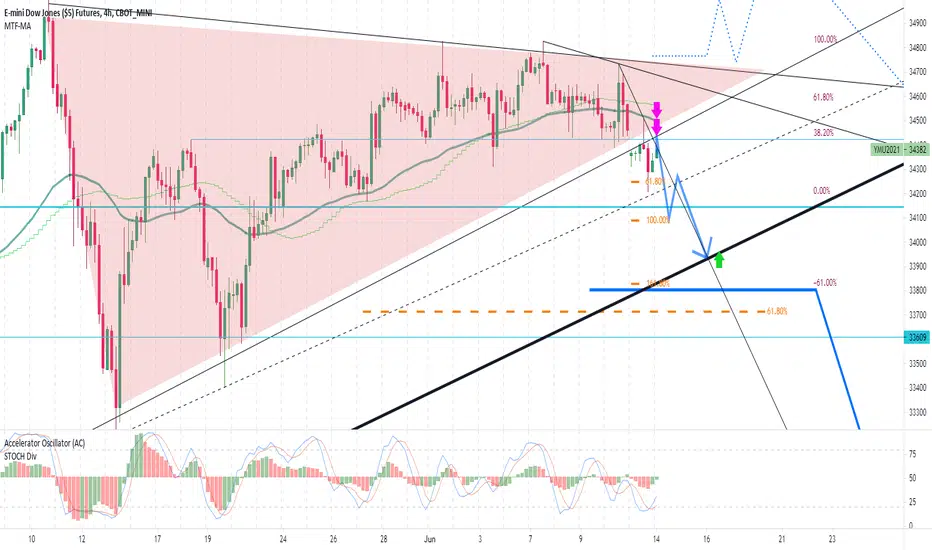
red arrow=powerfull sellimit place with sl and trailstop= 80
green arrow=buylimit place with sl and trailstop=80
if big trend (daily chart trend line start from corona crash) near 33900 break , you can sell
tradingview.com/chart/jtsoM2GC/
red arrow=powerfull sellimit place with sl and trailstop= 80
green arrow=buylimit place with sl and trailstop=80
if big trend (daily chart trend line start from corona crash) near 33900 break , you can sell
免責聲明
這些資訊和出版物並非旨在提供,也不構成TradingView提供或認可的任何形式的財務、投資、交易或其他類型的建議或推薦。請閱讀使用條款以了解更多資訊。
免責聲明
這些資訊和出版物並非旨在提供,也不構成TradingView提供或認可的任何形式的財務、投資、交易或其他類型的建議或推薦。請閱讀使用條款以了解更多資訊。