OPEN-SOURCE SCRIPT
Trend Continuation Ratio
This TradingView indicator calculates the likelihood of consecutive bullish or bearish days over a specified period, giving insights into day-to-day continuation patterns within the market.
How It Works
Period Length Input:
Bullish and Bearish Day Definitions:
Count Tracking:
Bullish to Bullish Continuations: Counts each instance where a bullish day is followed by another bullish day.
Bearish to Bearish Continuations: Counts each instance where a bearish day is followed by another bearish day.
Calculating Continuation Ratios:
The Bullish Continuation Ratio is calculated as the percentage of bullish days that were followed by another bullish day:
Bullish Continuation Ratio = (Bullish to Bullish Continuations /Total Bullish Days)×100
Bullish Continuation Ratio=( Total Bullish Days/Bullish to Bullish Continuations )×100
The Bearish Continuation Ratio is the percentage of bearish days followed by another bearish day:
Bearish Continuation Ratio = (Bearish to Bearish Continuations/Total Bearish Days)×100
Bearish Continuation Ratio=( Total Bearish Days/Bearish to Bearish Continuations )×100
Display on Chart:
The indicator displays a table in the top-right corner of the chart with:
Usage Insights
This indicator is helpful for assessing short-term trend continuation tendencies, allowing traders to gauge whether they are more likely to see follow-through on bullish or bearish days within a chosen timeframe.
How It Works
Period Length Input:
- The user sets the period length (e.g., 20 days) to analyze.
- After each period, the counts reset, allowing fresh data for each new interval.
Bullish and Bearish Day Definitions:
- A day is considered bullish if the closing price is higher than the opening price.
- A day is considered bearish if the closing price is lower than the opening price.
Count Tracking:
- Within each specified period, the indicator tracks:
- Total Bullish Days: The number of days where the close is greater than the open.
- Total Bearish Days: The number of days where the close is less than the open.
Bullish to Bullish Continuations: Counts each instance where a bullish day is followed by another bullish day.
Bearish to Bearish Continuations: Counts each instance where a bearish day is followed by another bearish day.
Calculating Continuation Ratios:
The Bullish Continuation Ratio is calculated as the percentage of bullish days that were followed by another bullish day:
Bullish Continuation Ratio = (Bullish to Bullish Continuations /Total Bullish Days)×100
Bullish Continuation Ratio=( Total Bullish Days/Bullish to Bullish Continuations )×100
The Bearish Continuation Ratio is the percentage of bearish days followed by another bearish day:
Bearish Continuation Ratio = (Bearish to Bearish Continuations/Total Bearish Days)×100
Bearish Continuation Ratio=( Total Bearish Days/Bearish to Bearish Continuations )×100
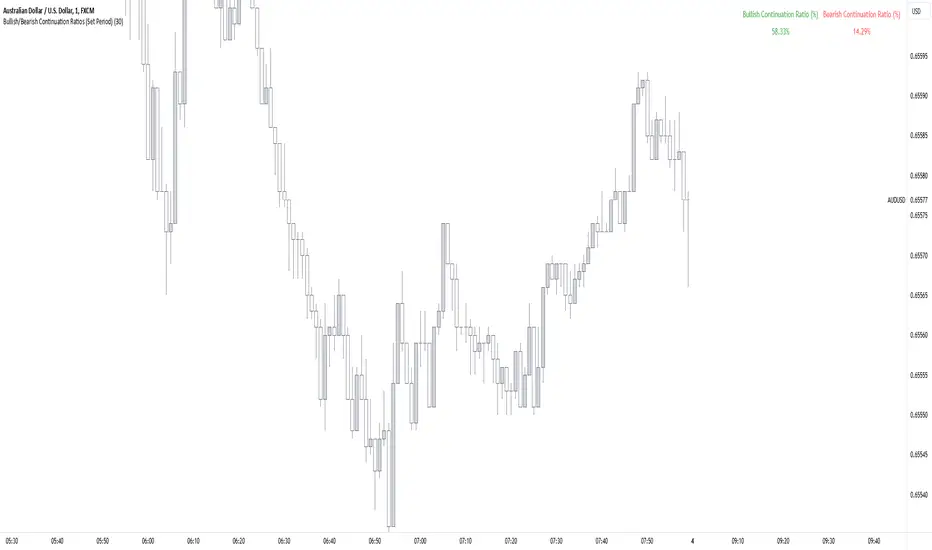
Display on Chart:
The indicator displays a table in the top-right corner of the chart with:
- Bullish Continuation Ratio (%): Percentage of bullish days that led to another bullish day within the period.
- Bearish Continuation Ratio (%): Percentage of bearish days that led to another bearish day within the period.
Usage Insights
- High Ratios: If the bullish or bearish continuation ratio is high, it suggests a trend where bullish/bearish days often lead to similar days, indicating possible momentum.
- Low Ratios: Low continuation ratios indicate frequent reversals, which could suggest a range-bound or volatile market.
This indicator is helpful for assessing short-term trend continuation tendencies, allowing traders to gauge whether they are more likely to see follow-through on bullish or bearish days within a chosen timeframe.
開源腳本
秉持TradingView一貫精神,這個腳本的創作者將其設為開源,以便交易者檢視並驗證其功能。向作者致敬!您可以免費使用此腳本,但請注意,重新發佈代碼需遵守我們的社群規範。
免責聲明
這些資訊和出版物並非旨在提供,也不構成TradingView提供或認可的任何形式的財務、投資、交易或其他類型的建議或推薦。請閱讀使用條款以了解更多資訊。
開源腳本
秉持TradingView一貫精神,這個腳本的創作者將其設為開源,以便交易者檢視並驗證其功能。向作者致敬!您可以免費使用此腳本,但請注意,重新發佈代碼需遵守我們的社群規範。
免責聲明
這些資訊和出版物並非旨在提供,也不構成TradingView提供或認可的任何形式的財務、投資、交易或其他類型的建議或推薦。請閱讀使用條款以了解更多資訊。