OPEN-SOURCE SCRIPT
High and Low of Last 5 Trading Days
### Indicator Description: High and Low of Last 5 Trading Days
**Indicator Name:** High and Low of Last 5 Trading Days
**Purpose:**
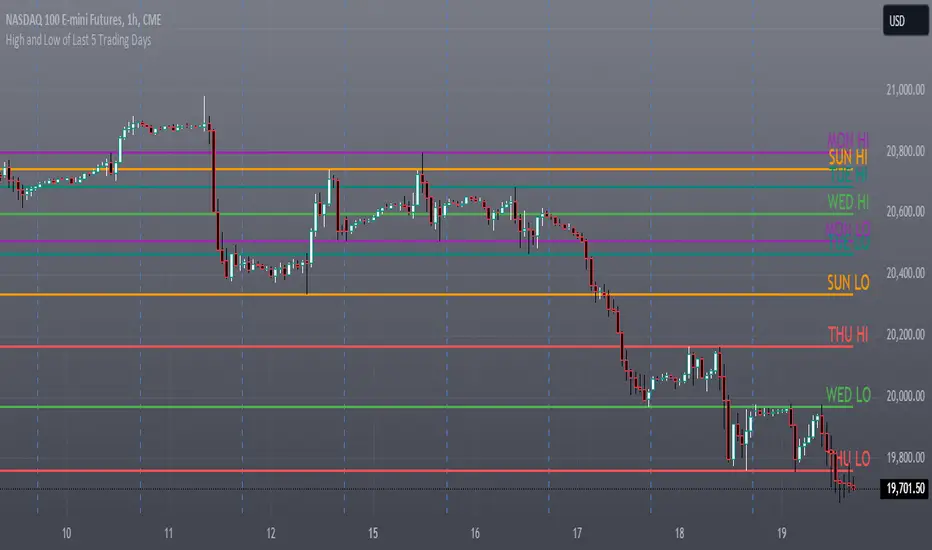
This indicator plots the high and low levels for each of the last 5 trading days on your TradingView chart. It helps traders to visualize important price levels from the recent trading history, which can act as potential support and resistance levels.
**Features:**
1. **Daily High and Low Levels:** Plots the high and low prices for each of the last 5 trading days.
2. **Unique Colors for Each Day:** Each trading day's high and low levels are color-coded uniquely for easy identification.
3. **Solid Lines:** The high and low levels are represented by solid lines for better visibility.
4. **Day Labels:** The lines are labeled with the corresponding day and whether it is a high or low level (e.g., "MON HI", "MON LO").
5. **Dynamic Updates:** The levels and labels are updated at the beginning of each new day, ensuring that the most recent 5 days are always displayed.
**Usage:**
- **Support and Resistance:** Identify key support and resistance levels based on the previous 5 days' high and low prices.
- **Trend Analysis:** Determine the recent price trend by observing the relative positioning of the daily high and low levels.
- **Price Action:** Analyze price action around these levels to make informed trading decisions.
**Configuration:**
- The indicator does not require any user input. It automatically calculates and displays the high and low levels for the past 5 trading days.
**Visual Elements:**
- **Lines:** Solid lines in different colors (red, green, teal, purple, orange) represent the high and low levels.
- **Labels:** Text labels at the right end of each line indicate the day and whether it is a high or low level (e.g., "MON HI", "TUE LO").
This indicator provides a clear visual representation of significant price levels from the recent trading history, aiding traders in their technical analysis and decision-making process.
**Indicator Name:** High and Low of Last 5 Trading Days
**Purpose:**
This indicator plots the high and low levels for each of the last 5 trading days on your TradingView chart. It helps traders to visualize important price levels from the recent trading history, which can act as potential support and resistance levels.
**Features:**
1. **Daily High and Low Levels:** Plots the high and low prices for each of the last 5 trading days.
2. **Unique Colors for Each Day:** Each trading day's high and low levels are color-coded uniquely for easy identification.
3. **Solid Lines:** The high and low levels are represented by solid lines for better visibility.
4. **Day Labels:** The lines are labeled with the corresponding day and whether it is a high or low level (e.g., "MON HI", "MON LO").
5. **Dynamic Updates:** The levels and labels are updated at the beginning of each new day, ensuring that the most recent 5 days are always displayed.
**Usage:**
- **Support and Resistance:** Identify key support and resistance levels based on the previous 5 days' high and low prices.
- **Trend Analysis:** Determine the recent price trend by observing the relative positioning of the daily high and low levels.
- **Price Action:** Analyze price action around these levels to make informed trading decisions.
**Configuration:**
- The indicator does not require any user input. It automatically calculates and displays the high and low levels for the past 5 trading days.
**Visual Elements:**
- **Lines:** Solid lines in different colors (red, green, teal, purple, orange) represent the high and low levels.
- **Labels:** Text labels at the right end of each line indicate the day and whether it is a high or low level (e.g., "MON HI", "TUE LO").
This indicator provides a clear visual representation of significant price levels from the recent trading history, aiding traders in their technical analysis and decision-making process.
開源腳本
秉持TradingView一貫精神,這個腳本的創作者將其設為開源,以便交易者檢視並驗證其功能。向作者致敬!您可以免費使用此腳本,但請注意,重新發佈代碼需遵守我們的社群規範。
免責聲明
這些資訊和出版物並非旨在提供,也不構成TradingView提供或認可的任何形式的財務、投資、交易或其他類型的建議或推薦。請閱讀使用條款以了解更多資訊。
開源腳本
秉持TradingView一貫精神,這個腳本的創作者將其設為開源,以便交易者檢視並驗證其功能。向作者致敬!您可以免費使用此腳本,但請注意,重新發佈代碼需遵守我們的社群規範。
免責聲明
這些資訊和出版物並非旨在提供,也不構成TradingView提供或認可的任何形式的財務、投資、交易或其他類型的建議或推薦。請閱讀使用條款以了解更多資訊。