INVITE-ONLY SCRIPT
New T - ZONE Indicator
已更新
✅ ssabu "New T - ZONE" Lecture Indicator
It is a secondary indicator that filters the buy interval for a position.
It also aims to capture the highs and lows of the trend.
However, the highs and lows of the trend are not for buying, but for selling.
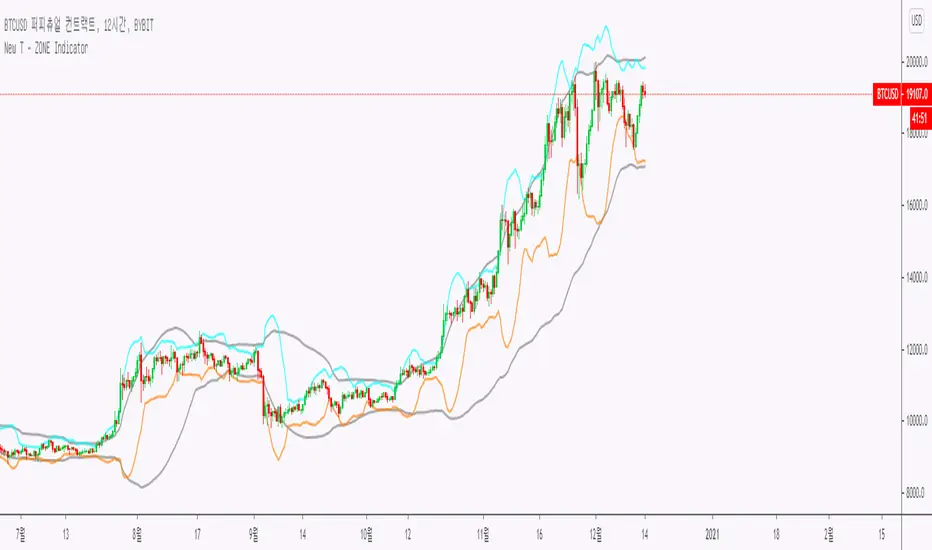
There is no repainting on the indicator, and the steep line, the steep line, the sell line + the long short line are added to the indicator, so you can get help in trading by section.
The gray line is the line that marks a sharp rise and fall, and the sky blue and orange lines are the lines that mark the sale.
✅ ssabu "뉴티존" 강의용보조지표
롱과 숏에 대한 매수구간을 필터링 해주는 수강생 전용 보조지표 입니다.
추세의 최고점과 최저점을 포착하는 것 또한 목표로 합니다.
하지만 추세의 최고점과 최저점은 매수를 위한 포착이 아닌 매도를 위한 포착이 됩니다.
지표에 리페인팅은 발생하지 않으며 급등선과 급락선 매도선 + 롱숏선이 지표에 추가되어 구간 별로 매매에 도움을 받을 수 있습니다
회색선은 급등과 급락을 표시해주는 선이고 하늘색과 주황색은 매도를 표시해주는 선이 됩니다.
트레이딩은 열심히 하는 것이 아니라 선택을 잘해야 하는 것이다
Trading is not about working hard, but choosing good
- SSABU -
It is a secondary indicator that filters the buy interval for a position.
It also aims to capture the highs and lows of the trend.
However, the highs and lows of the trend are not for buying, but for selling.
There is no repainting on the indicator, and the steep line, the steep line, the sell line + the long short line are added to the indicator, so you can get help in trading by section.
The gray line is the line that marks a sharp rise and fall, and the sky blue and orange lines are the lines that mark the sale.
✅ ssabu "뉴티존" 강의용보조지표
롱과 숏에 대한 매수구간을 필터링 해주는 수강생 전용 보조지표 입니다.
추세의 최고점과 최저점을 포착하는 것 또한 목표로 합니다.
하지만 추세의 최고점과 최저점은 매수를 위한 포착이 아닌 매도를 위한 포착이 됩니다.
지표에 리페인팅은 발생하지 않으며 급등선과 급락선 매도선 + 롱숏선이 지표에 추가되어 구간 별로 매매에 도움을 받을 수 있습니다
회색선은 급등과 급락을 표시해주는 선이고 하늘색과 주황색은 매도를 표시해주는 선이 됩니다.
트레이딩은 열심히 하는 것이 아니라 선택을 잘해야 하는 것이다
Trading is not about working hard, but choosing good
- SSABU -
發行說明
PM us to obtain access【 트레이딩뷰 매니아 】
cafe.naver.com/tradingviewmania
【 트레이딩 시스템 】
tradingviewmania-menu.oopy.io/
【 카톡 】
bit.ly/싸부_문의1
【 텔레그램 】
bit.ly/싸부텔레
cafe.naver.com/tradingviewmania
【 트레이딩 시스템 】
tradingviewmania-menu.oopy.io/
【 카톡 】
bit.ly/싸부_문의1
【 텔레그램 】
bit.ly/싸부텔레
免責聲明
這些資訊和出版物並不意味著也不構成TradingView提供或認可的金融、投資、交易或其他類型的意見或建議。請在使用條款閱讀更多資訊。