OPEN-SOURCE SCRIPT
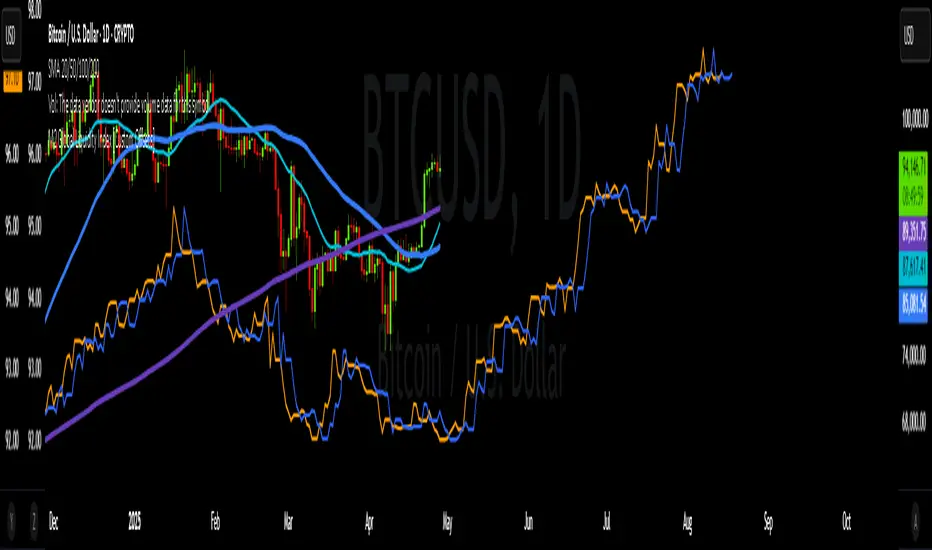
M2 Global Liquidity Index [Custom Offsets]
M2 Global Liquidity Index [Custom Offsets]
Plots the global M2 money supply alongside price, with two user-configurable forward shifts to help you anticipate macro-driven moves in BTC (or any asset).
Key Features
Current M2 Index (no offset)
Offset A — shift M2 forward by N days (default 78)
Offset B — shift M2 forward by M days (default 109)
Extended Currencies toggle adds 9 additional central banks (CHF, CAD, INR, RUB, BRL, KRW, MXN, ZAR)
All lines share the left-hand axis and scale to trillions
Inputs
Offset A (days): integer ≥ 0 (default 78)
Offset B (days): integer ≥ 0 (default 109)
Include extended currencies?: on/off
How to Use
Add the indicator to any chart (overlay mode).
In Settings → Inputs, enter your desired lead times for Offset A and Offset B.
Toggle extended currencies if you need a broader “global liquidity” view.
Watch how price action (e.g. BTC) tracks the shifted M2 lines to spot potential turning points.
Why It Matters
Changes in money supply often lead risk assets by several weeks to months. This tool makes it easy to visualize and test those correlations directly on your favorite timeframe.
開源腳本
秉持TradingView一貫精神,這個腳本的創作者將其設為開源,以便交易者檢視並驗證其功能。向作者致敬!您可以免費使用此腳本,但請注意,重新發佈代碼需遵守我們的社群規範。
免責聲明
這些資訊和出版物並非旨在提供,也不構成TradingView提供或認可的任何形式的財務、投資、交易或其他類型的建議或推薦。請閱讀使用條款以了解更多資訊。
開源腳本
秉持TradingView一貫精神,這個腳本的創作者將其設為開源,以便交易者檢視並驗證其功能。向作者致敬!您可以免費使用此腳本,但請注意,重新發佈代碼需遵守我們的社群規範。
免責聲明
這些資訊和出版物並非旨在提供,也不構成TradingView提供或認可的任何形式的財務、投資、交易或其他類型的建議或推薦。請閱讀使用條款以了解更多資訊。