OPEN-SOURCE SCRIPT
Highs/Lows difference [OrganicPunch]
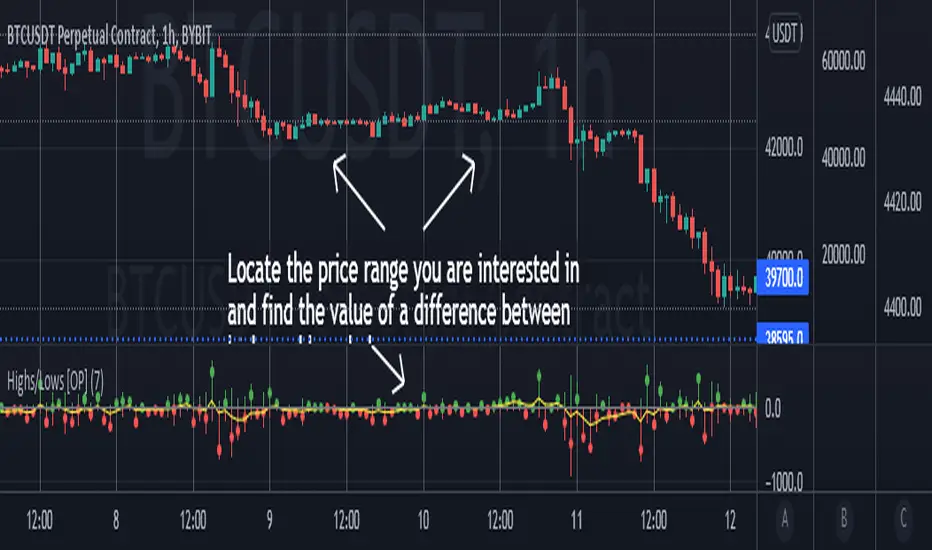
Highs/Lows difference indicator
To visually evaluate the difference between highs and lows of a price range.
This handsome indicator shows:
To read the numerical value, point at the circle of the relevant bar you are interested in, and see the scale.
Indicator is useful in creating strategies where you want to filter out consolidations/ranges (or to locate them), e.g. "Open trade when H/L difference is larger than 200", or "Look for candles with H/L difference lesser than 50".
The exact value of needed H/L difference can be found using this indicator.
To visually evaluate the difference between highs and lows of a price range.
This handsome indicator shows:
- difference between highs of 2 candles by displaying it in green histogram
- difference between lows of 2 candles by displaying it in red histogram
- difference between both highs and lows by displaying a circle at the level of the difference
To read the numerical value, point at the circle of the relevant bar you are interested in, and see the scale.
Indicator is useful in creating strategies where you want to filter out consolidations/ranges (or to locate them), e.g. "Open trade when H/L difference is larger than 200", or "Look for candles with H/L difference lesser than 50".
The exact value of needed H/L difference can be found using this indicator.
開源腳本
秉持TradingView一貫精神,這個腳本的創作者將其設為開源,以便交易者檢視並驗證其功能。向作者致敬!您可以免費使用此腳本,但請注意,重新發佈代碼需遵守我們的社群規範。
免責聲明
這些資訊和出版物並非旨在提供,也不構成TradingView提供或認可的任何形式的財務、投資、交易或其他類型的建議或推薦。請閱讀使用條款以了解更多資訊。
開源腳本
秉持TradingView一貫精神,這個腳本的創作者將其設為開源,以便交易者檢視並驗證其功能。向作者致敬!您可以免費使用此腳本,但請注意,重新發佈代碼需遵守我們的社群規範。
免責聲明
這些資訊和出版物並非旨在提供,也不構成TradingView提供或認可的任何形式的財務、投資、交易或其他類型的建議或推薦。請閱讀使用條款以了解更多資訊。