OPEN-SOURCE SCRIPT
已更新 Expected Move by Option's Implied Volatility High Liquidity
https://www.tradingview.com/x/6vCxo68C/
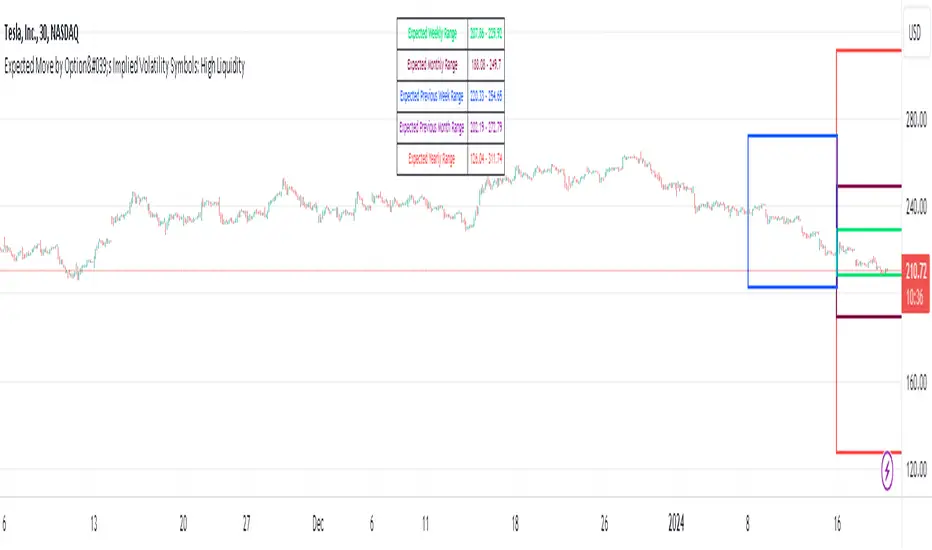
This script plots boxes to reflect weekly, monthly and yearly expected moves based on "At The Money" put and call option's implied volatility.
Symbols in range: This script will display Expected Move data for Symbols with high option liquidity.
Weekly Updates: Each weekend, the script is updated with fresh expected move data, a job that takes place every Saturday following the close of the markets on Friday.
In the provided script, several boxes are created and plotted on a price chart to represent the expected price moves for various timeframes.
These boxes serve as visual indicators to help traders and analysts understand the expected price volatility.
Definition of Expected Move: Expected Move refers to the anticipated range within which the price of an underlying asset is expected to move over a specific time frame, based on the current implied volatility of its options. Calculation: Expected Move is typically calculated by taking the current stock price and applying a multiple of the implied volatility. The most commonly used multiple is the one-standard-deviation move, which encompasses approximately 68% of potential price outcomes.
Example: Suppose a stock is trading at $100, and the implied volatility of its options is 20%. The one-standard-deviation expected move would be $100 * 0.20 = $20.
This suggests that there is a 68% probability that the stock's price will stay within a range of $80 to $120 over the specified time frame. Usage: Traders and investors use the expected move as a guideline for setting trading strategies and managing risk. It helps them gauge the potential price swings and make informed decisions about buying or selling options.There is a 68% chance that the underlying asset stock or ETF price will be within the boxed area at option expiry. The data on this script is updating weekly at the close of Friday, calculating the implied volatility for the week/month/year based on the "at the money" put and call options with the relevant expiry. This script will display Expected Move data for Symbols within the range of JBL-NOTE in alphabetical order.
In summary, implied volatility reflects market expectations about future price volatility, especially in the context of options. Expected Move is a practical application of implied volatility, helping traders estimate the likely price range for an asset over a given period. Both concepts play a vital role in assessing risk and devising trading strategies in the options and stock markets.
發行說明
This script plots boxes to reflect weekly, monthly and yearly expected moves based on "At The Money" put and call option's implied volatility.Symbols in range: This script will display Expected Move data for Symbols with high option liquidity.
Weekly Updates: Each weekend, the script is updated with fresh expected move data, a job that takes place every Saturday following the close of the markets on Friday.
In the provided script, several boxes are created and plotted on a price chart to represent the expected price moves for various timeframes.
These boxes serve as visual indicators to help traders and analysts understand the expected price volatility.
發行說明
This script plots boxes to reflect weekly, monthly and yearly expected moves based on "At The Money" put and call option's implied volatility.Symbols in range: This script will display Expected Move data for Symbols with high option liquidity, go to impliedvolatility.net for a full report.
Weekly Updates: Each weekend, the script is updated with fresh expected move data, a job that takes place every Saturday following the close of the markets on Friday.
In the provided script, several boxes are created and plotted on a price chart to represent the expected price moves for various timeframes.
These boxes serve as visual indicators to help traders and analysts understand the expected price volatility.
發行說明
This script will display Expected Move data for Symbols with high option liquidity, go to the site impliedvolatility.net for a full implied volatility scan report for crypto,futures options and stocks of 4000 symbol.Weekly Updates: Each weekend, the script is updated with fresh expected move data, a job that takes place every Saturday following the close of the markets on Friday.
In the provided script, several boxes are created and plotted on a price chart to represent the expected price moves for various timeframes.
These boxes serve as visual indicators to help traders and analysts understand the expected price volatility.
開源腳本
秉持TradingView一貫精神,這個腳本的創作者將其設為開源,以便交易者檢視並驗證其功能。向作者致敬!您可以免費使用此腳本,但請注意,重新發佈代碼需遵守我們的社群規範。
免責聲明
這些資訊和出版物並非旨在提供,也不構成TradingView提供或認可的任何形式的財務、投資、交易或其他類型的建議或推薦。請閱讀使用條款以了解更多資訊。
開源腳本
秉持TradingView一貫精神,這個腳本的創作者將其設為開源,以便交易者檢視並驗證其功能。向作者致敬!您可以免費使用此腳本,但請注意,重新發佈代碼需遵守我們的社群規範。
免責聲明
這些資訊和出版物並非旨在提供,也不構成TradingView提供或認可的任何形式的財務、投資、交易或其他類型的建議或推薦。請閱讀使用條款以了解更多資訊。