OPEN-SOURCE SCRIPT
已更新 FACTOR MONITOR
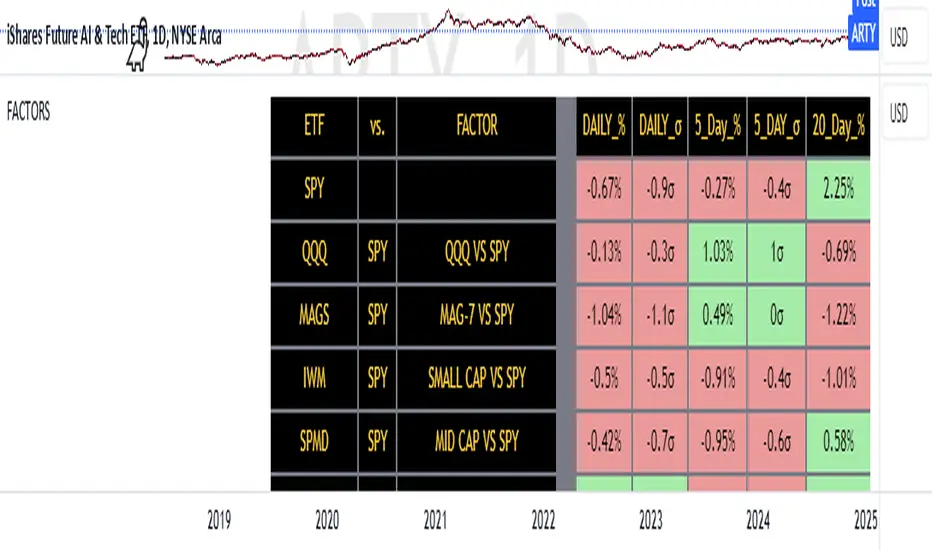
The Factor Monitor is a comprehensive designed to track relative strength and standard deviation movements across multiple market segments and investment factors. The indicator calculates and displays normalized percentage moves and their statistical significance (measured in standard deviations) across daily, 5-day, and 20-day periods, providing a multi-timeframe view of market dynamics.
Key Features:
Real-time tracking of relative performance between various ETF pairs (e.g., QQQ vs SPY, IWM vs SPY)
Standard deviation scoring system that identifies statistically significant moves
Color-coded visualization (green/red) for quick interpretation of relative strength
Multiple timeframe analysis (1-day, 5-day, and 20-day moves)
Monitoring of key market segments:
Style factors (Value, Growth, Momentum)
Market cap segments (Large, Mid, Small)
Sector relative strength
Risk factors (High Beta vs Low Volatility)
Credit conditions (High Yield vs Investment Grade)
The tool is particularly valuable for:
Identifying significant factor rotations in the market
Assessing market breadth through relative strength comparisons
Spotting potential trend changes through statistical deviation analysis
Monitoring sector leadership and market regime shifts
Quantifying the magnitude of market moves relative to historical norms
發行說明
Just changed colors around to make more readable發行說明
Updated MAGS exchange開源腳本
秉持TradingView一貫精神,這個腳本的創作者將其設為開源,以便交易者檢視並驗證其功能。向作者致敬!您可以免費使用此腳本,但請注意,重新發佈代碼需遵守我們的社群規範。
免責聲明
這些資訊和出版物並非旨在提供,也不構成TradingView提供或認可的任何形式的財務、投資、交易或其他類型的建議或推薦。請閱讀使用條款以了解更多資訊。
免責聲明
這些資訊和出版物並非旨在提供,也不構成TradingView提供或認可的任何形式的財務、投資、交易或其他類型的建議或推薦。請閱讀使用條款以了解更多資訊。