PINE LIBRARY
已更新 DrawIndicatorOnTheChart
Library "DrawIndicatorOnTheChart"
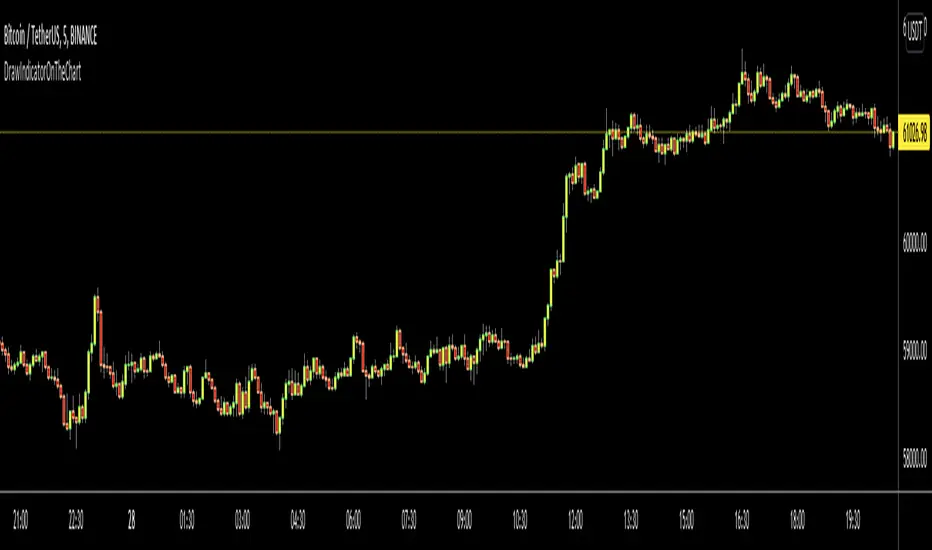
this library is used to show an indicator (such RSI, CCI, MOM etc) on the main chart with indicator's horizontal lines in a window. Location of the window is calculated dynamically by last price movemements
drawIndicator(indicatorName, indicator, indicatorcolor, period, indimax_, indimin_, levels, precision, xlocation) draws the related indicator on the chart
Parameters:
indicatorName: is the indicator name as string such "RSI", "CCI" etc
indicator: is the indicator you want to show, such rsi(close, 14), mom(close, 10) etc
indicatorcolor: is the color of indicator line
period: is the length of the window to show
indimax_: is the maximum value of the indicator, for example for RSI it's 100.0, if the indicator (such CCI, MOM etc) doesn't have maximum value then use "na"
indimin_: is the minimum value of the indicator, for example for RSI it's 0.0, if the indicator (such CCI, MOM etc)doesn't have maximum value then use "na"
levels: is the levels of the array for the horizontal lines. for example if you want horizontal lines at 30.0, and 70.0 then use array.from(30.0, 70.0). if no horizontal lines then use array.from(na)
precision: is the precision/number of decimals that is used to show indicator values, for example for RSI set it 2
xlocation: is end location of the indicator window, for example if xlocation = 0 window is created on the index of the last bar/candle
Returns: none
發行說明
v2background color of the window changed as black
發行說明
v3發行說明
v4發行說明
v5: - updated to show multiple indicator lines for the indicators such DMI
- so indicator parameter changed to indicator1, indicator2, indicator3 (if indicator2 or indicator3 doesn't exist then send na value)
- added line width parameter
- color parameter changed to the array
Updated:
drawIndicator(enabled, indicatorName, indicator1, indicator2, indicator3, indicatorcolor, period, indimax_, indimin_, levels, precision, xlocation, lnwidth) draws the related indicator on the chart
Parameters:
enabled: if it's enabled to show
indicatorName: is the indicator name as string such "RSI", "CCI" etc
indicator1: is first indicator you want to show, such rsi(close, 14), mom(close, 10) etc
indicator2: is second indicator you want to show, such -DI of DMI
indicator3: is third indicator you want to show, such ADX of DMI
indicatorcolor: is the color of indicator line
period: is the length of the window to show
indimax_: is the maximum value of the indicator, for example for RSI it's 100.0, if the indicator (such CCI, MOM etc) doesn't have maximum value then use "na"
indimin_: is the minimum value of the indicator, for example for RSI it's 0.0, if the indicator (such CCI, MOM etc)doesn't have maximum value then use "na"
levels: is the levels of the array for the horizontal lines. for example if you want horizontal lines at 30.0, and 70.0 then use array.from(30.0, 70.0). if no horizontal lines then use array.from(na)
precision: is the precision/nuber of decimals that is used to show indicator values, for example for RSI set it 2
xlocation: is end location of the indicator window, for example if xlocation = 0 window is created on the index of the last bar/candle
lnwidth: is the line width of the indicator lines
Returns: none
發行說明
v6Somehow indicator doesn't show the lines. fixed. Thank to TanHef for the solution
Pine腳本庫
秉持TradingView一貫精神,作者已將此Pine代碼以開源函式庫形式發佈,方便我們社群中的其他Pine程式設計師重複使用。向作者致敬!您可以在私人專案或其他開源發表中使用此函式庫,但在公開發表中重用此代碼須遵守社群規範。
Official Telegram Channel: t.me/LonesomeTheBlue_Official
You can get monthly subscription to my Pro indicators. Please visit my "LTB Professional Trading Suite" for more info
You can get monthly subscription to my Pro indicators. Please visit my "LTB Professional Trading Suite" for more info
免責聲明
這些資訊和出版物並非旨在提供,也不構成TradingView提供或認可的任何形式的財務、投資、交易或其他類型的建議或推薦。請閱讀使用條款以了解更多資訊。