INVITE-ONLY SCRIPT
RS30 Module
What is this?
This module will helps you to sell faster (profit taking) when price reserve without waiting price drop too much.
The Indicators & strategies?
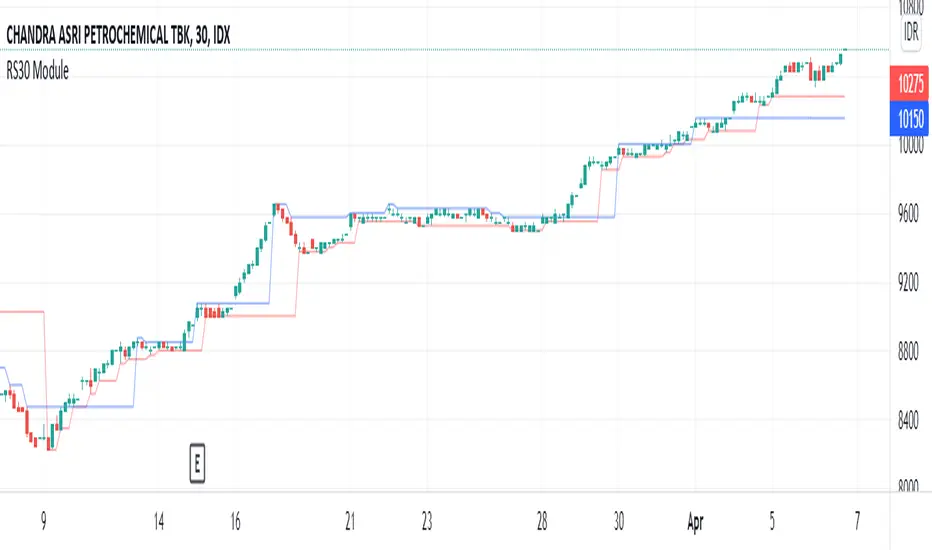
This module consist of short term resist and support (R/S). This R/S is based on price fractals, modified to a simpler visualization, we called: RS30 which used in 30 minutes chart.
This RS30 (the blue (R) & red (S) lines) works when price move in bullish mode on daily basis, but you want to take profit on intraday basis. As price rally, 30minutes chart will keep going up and the support (red) line. You can watch this indicator, if the 30minutes chart go down and breaks S (red line), ist the best time to sell, means a better profit compared if you wait a daily chart reverse.
Benefit For You
You'll have a guidance how to follow the trend while the major trend is as you expected and sell better to take profit before the major top reversal.
This module will helps you to sell faster (profit taking) when price reserve without waiting price drop too much.
The Indicators & strategies?
This module consist of short term resist and support (R/S). This R/S is based on price fractals, modified to a simpler visualization, we called: RS30 which used in 30 minutes chart.
This RS30 (the blue (R) & red (S) lines) works when price move in bullish mode on daily basis, but you want to take profit on intraday basis. As price rally, 30minutes chart will keep going up and the support (red) line. You can watch this indicator, if the 30minutes chart go down and breaks S (red line), ist the best time to sell, means a better profit compared if you wait a daily chart reverse.
Benefit For You
You'll have a guidance how to follow the trend while the major trend is as you expected and sell better to take profit before the major top reversal.
僅限邀請腳本
僅限作者授權的用戶訪問此腳本,並且通常需要付費。您可以將其增加到收藏腳本中,但是只有在向作者請求並獲得許可之後,才能使用它。 請聯繫galerisaham以了解更多信息,或按照下面作者的說明進行操作。
TradingView 不建議購買並使用此腳本,除非您 100% 信任其作者並了解腳本的工作原理。在許多情況下,您可以在我們的社群腳本中免費找到良好的開源替代方案。
作者的說明
″To use this scipt, visit https://galerisaham.com/modul for further information.
想在圖表上使用此腳本?
警告:請閱讀,然後再請求訪問權限。
We Build Profitable Traders | Visit: galerisaham.com/pro/
免責聲明
這些資訊和出版物並不意味著也不構成TradingView提供或認可的金融、投資、交易或其他類型的意見或建議。請在使用條款閱讀更多資訊。