OPEN-SOURCE SCRIPT
已更新 Original Bravo Swing
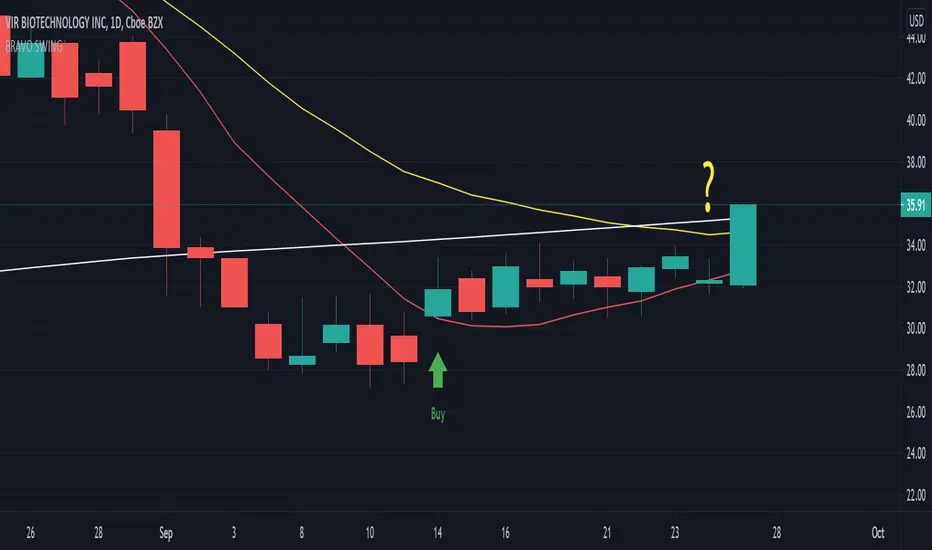
The Bravo Swing is based on the methods taught by YouTube celebrity J Bravo.
It uses the 9 day moving average as a base for selecting optimal entry and exit points.
Buy indicator:
A full candle closing above the 9 day moving average generally indicates a bullish signal for an entry.
If conditions are right, this can be seen as a great opportunity to buy.
Sell indicator:
If the candles continue to close above the 9 day moving average, the trend appears to remain bullish.
However, an exit is to be considered once a candle closes below the 9 day moving average, as this indicates a bearish signal may be approaching.
If you you're feeling confident about the uptrend continuing and choose to ignore the exit signal, a candle close below the 20 day exponential moving average should be used as a definite exit point.
Options:
Color code option to display the 180 day moving average in gray during downtrends and white during an uptrend.
The 50 day moving average can be turned on to help better visualize conflicting trends.
發行說明
The sell indicator now shows ONLY when a red candle closes below the SMA 9 - indicating a strong bearish momentum.A question mark is now displayed when a green candle closes below the SMA 9 - indicating a 'possible' bearish momentum and an early exit should be considered (this can be turned off in settings).
開源腳本
秉持TradingView一貫精神,這個腳本的創作者將其設為開源,以便交易者檢視並驗證其功能。向作者致敬!您可以免費使用此腳本,但請注意,重新發佈代碼需遵守我們的社群規範。
免責聲明
這些資訊和出版物並非旨在提供,也不構成TradingView提供或認可的任何形式的財務、投資、交易或其他類型的建議或推薦。請閱讀使用條款以了解更多資訊。
免責聲明
這些資訊和出版物並非旨在提供,也不構成TradingView提供或認可的任何形式的財務、投資、交易或其他類型的建議或推薦。請閱讀使用條款以了解更多資訊。