OPEN-SOURCE SCRIPT
Days Since –1% Down Close
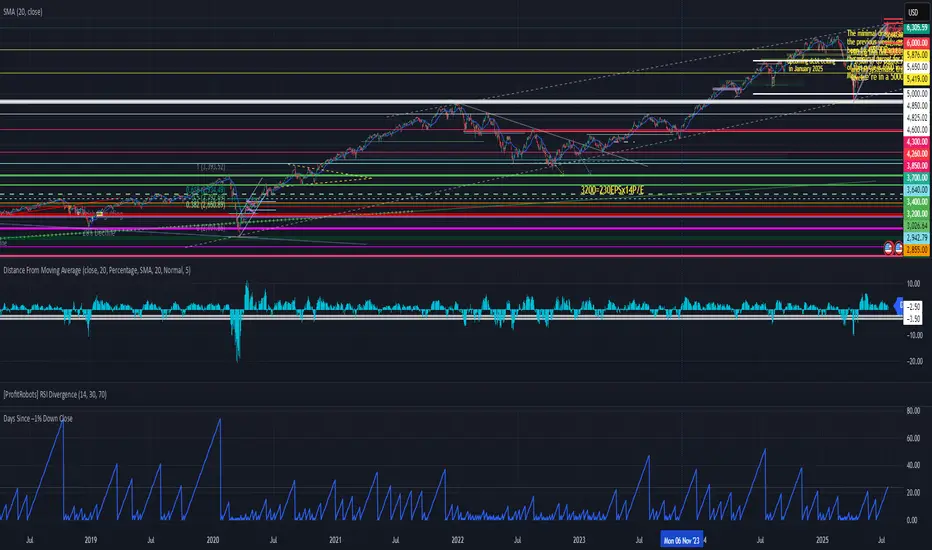
“Days since last down 1% close” indicator
This is a useful tool for investors and analysts to gauge market momentum, volatility, and potential risk:
1. Measuring Market Stability and Momentum
2. Identifying Potential Overbought Conditions
3. Volatility Assessment
4. Contextualizing Seasonal or External Factors
5. Risk Management and Timing
Actionable Insight: Combine this with real-time data (e.g., VIX levels or economic releases like tomorrow’s potential market-moving news)
In summary, the "Days since last down 1% close" indicator helps investors monitor market health, spot overextension, and manage risk by providing a historical benchmark for volatility.
開源腳本
本著TradingView的真正精神,此腳本的創建者將其開源,以便交易者可以查看和驗證其功能。向作者致敬!雖然您可以免費使用它,但請記住,重新發佈程式碼必須遵守我們的網站規則。
免責聲明
這些資訊和出版物並不意味著也不構成TradingView提供或認可的金融、投資、交易或其他類型的意見或建議。請在使用條款閱讀更多資訊。
開源腳本
本著TradingView的真正精神,此腳本的創建者將其開源,以便交易者可以查看和驗證其功能。向作者致敬!雖然您可以免費使用它,但請記住,重新發佈程式碼必須遵守我們的網站規則。
免責聲明
這些資訊和出版物並不意味著也不構成TradingView提供或認可的金融、投資、交易或其他類型的意見或建議。請在使用條款閱讀更多資訊。